Fig. 14
Download original image
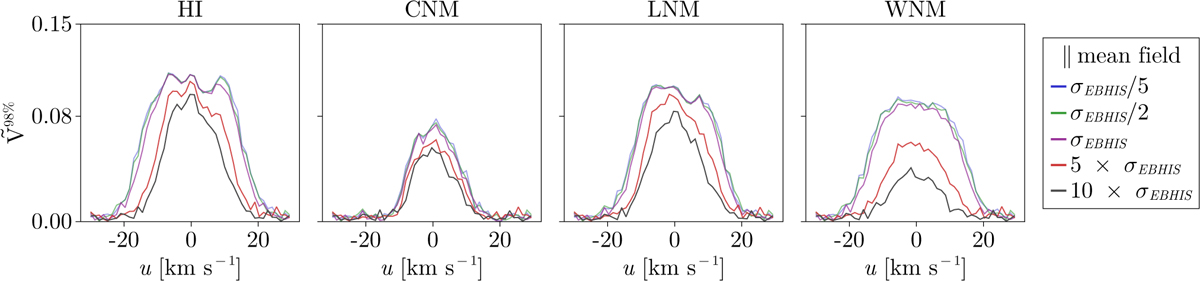
Effect of increasing noise in H i data on the HOG correlation with Faraday tomography structures for the case-study simulation along the mean field. Each panel displays the 98th percentile of the normalized Rayleigh statistic ![]() as a function of Faraday depth, ϕ, for the CNM and WNM phases. The different lines correspond to different levels of added Gaussian noise in the H i cubes, ranging from σEBHIS/5 to 10 × σEBHIS. While increasing noise decreases the overall correlation strength, the WNM remains more affected than the CNM, particularly at high velocities.
as a function of Faraday depth, ϕ, for the CNM and WNM phases. The different lines correspond to different levels of added Gaussian noise in the H i cubes, ranging from σEBHIS/5 to 10 × σEBHIS. While increasing noise decreases the overall correlation strength, the WNM remains more affected than the CNM, particularly at high velocities.
Current usage metrics show cumulative count of Article Views (full-text article views including HTML views, PDF and ePub downloads, according to the available data) and Abstracts Views on Vision4Press platform.
Data correspond to usage on the plateform after 2015. The current usage metrics is available 48-96 hours after online publication and is updated daily on week days.
Initial download of the metrics may take a while.