Open Access
Fig. 17
Download original image
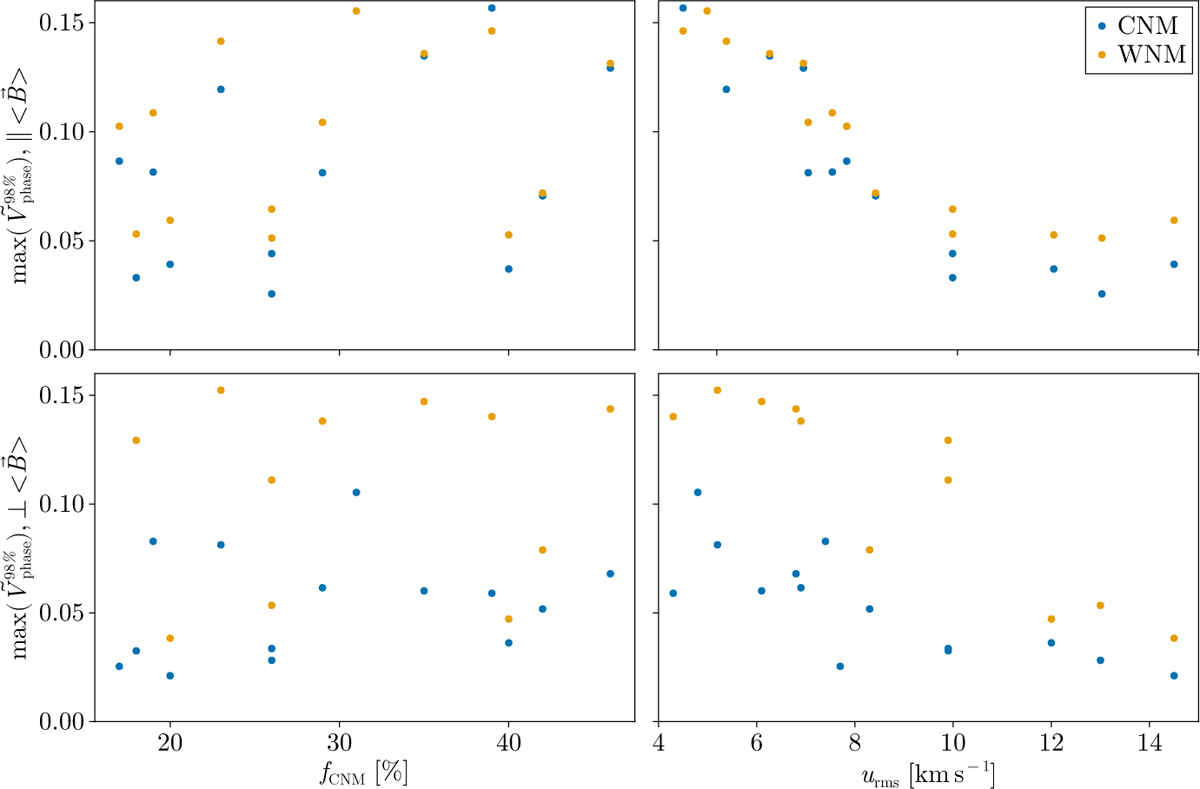
Compilation for all simulations of the maximum value of the 98th percentile of the normalized Rayleigh statistic ![]() as a function of fCNM (left) and uRMS (right). Cases for B perpendicular (bottom) and parallel (top) to the LOS are shown. In each panel, the data points show the values of
as a function of fCNM (left) and uRMS (right). Cases for B perpendicular (bottom) and parallel (top) to the LOS are shown. In each panel, the data points show the values of ![]() for the CNM (blue) and WNM (yellow).
for the CNM (blue) and WNM (yellow).
Current usage metrics show cumulative count of Article Views (full-text article views including HTML views, PDF and ePub downloads, according to the available data) and Abstracts Views on Vision4Press platform.
Data correspond to usage on the plateform after 2015. The current usage metrics is available 48-96 hours after online publication and is updated daily on week days.
Initial download of the metrics may take a while.