Fig. 18
Download original image
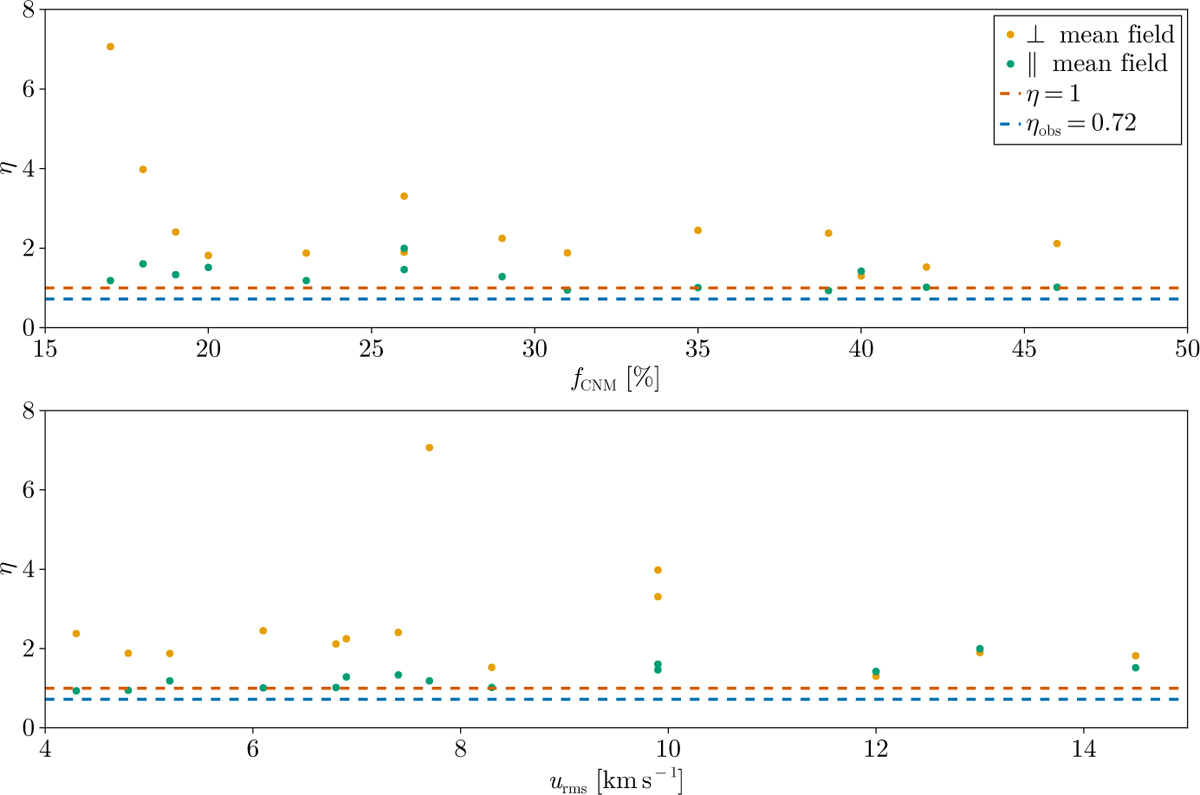
Compilation for all simulations of the maximum HOG correlation coefficient, η, as a function of fCNM (top) and uRMS (bottom). The data points show η measured in orientations of the LOS parallel (green) and perpendicular (yellow) to the mean magnetic field. The dashed line at η = 1 separates the CNM-dominated (η < 1) from the WNM-dominated (η > 1) regime. The observed value in the 3C196 field is ηobs = 0.72.
Current usage metrics show cumulative count of Article Views (full-text article views including HTML views, PDF and ePub downloads, according to the available data) and Abstracts Views on Vision4Press platform.
Data correspond to usage on the plateform after 2015. The current usage metrics is available 48-96 hours after online publication and is updated daily on week days.
Initial download of the metrics may take a while.