Fig. C.1
Download original image
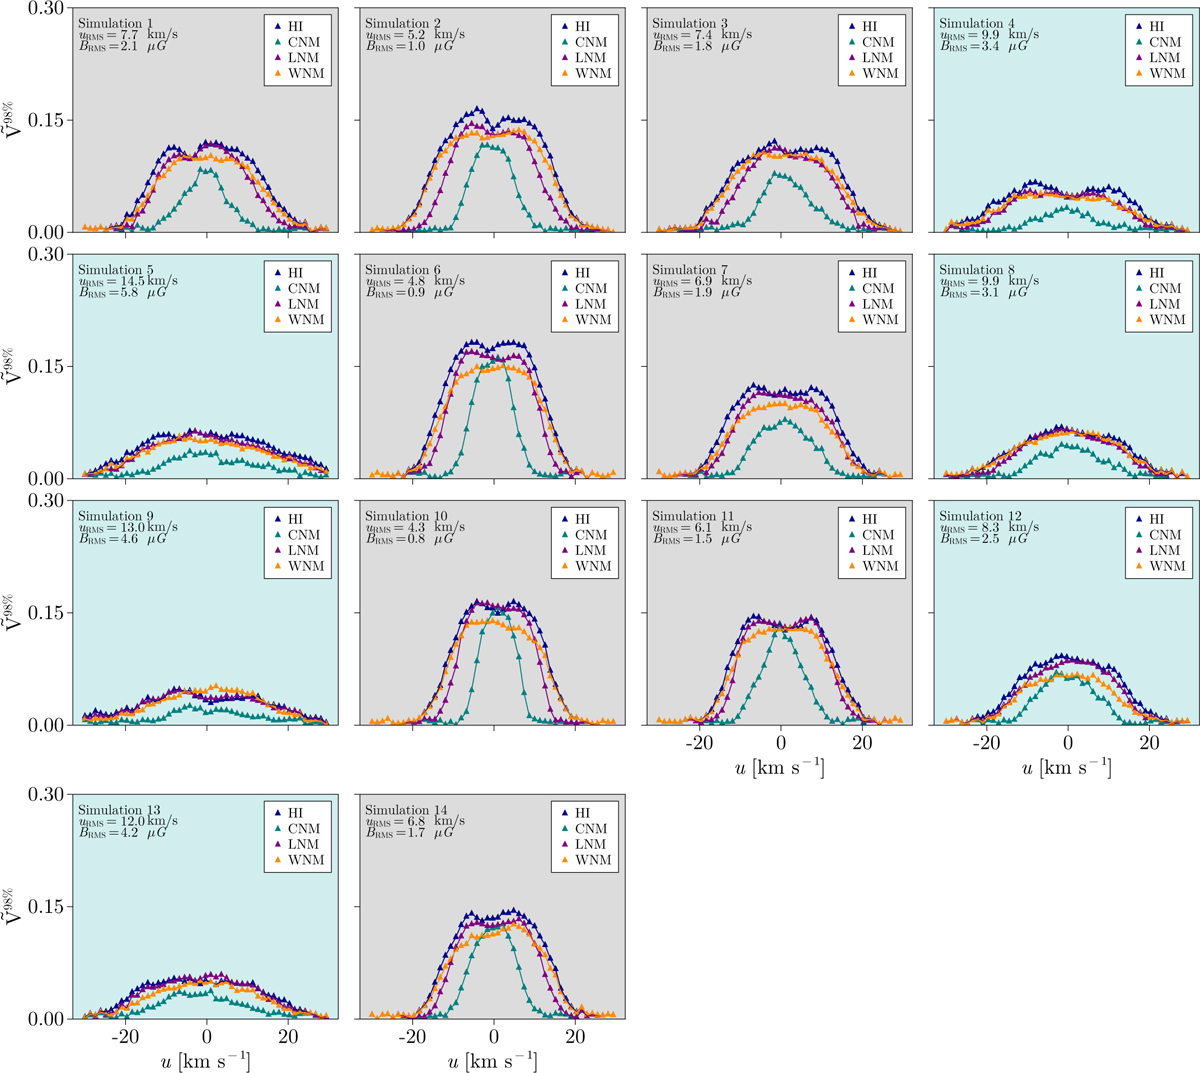
HOG results for all the set of simulations for the orientation of the LOS parallel to mean B. In each panel the curve ![]() vs u is shown for all H i phases. Light blue backgrounds are simulations with higher turbulence (vRMS > 8 km s−1) corresponding to higher magnetic field dispersion (BRMS > 2.5 µG). Gray backgrounds are the complement.
vs u is shown for all H i phases. Light blue backgrounds are simulations with higher turbulence (vRMS > 8 km s−1) corresponding to higher magnetic field dispersion (BRMS > 2.5 µG). Gray backgrounds are the complement.
Current usage metrics show cumulative count of Article Views (full-text article views including HTML views, PDF and ePub downloads, according to the available data) and Abstracts Views on Vision4Press platform.
Data correspond to usage on the plateform after 2015. The current usage metrics is available 48-96 hours after online publication and is updated daily on week days.
Initial download of the metrics may take a while.