Fig. 4
Download original image
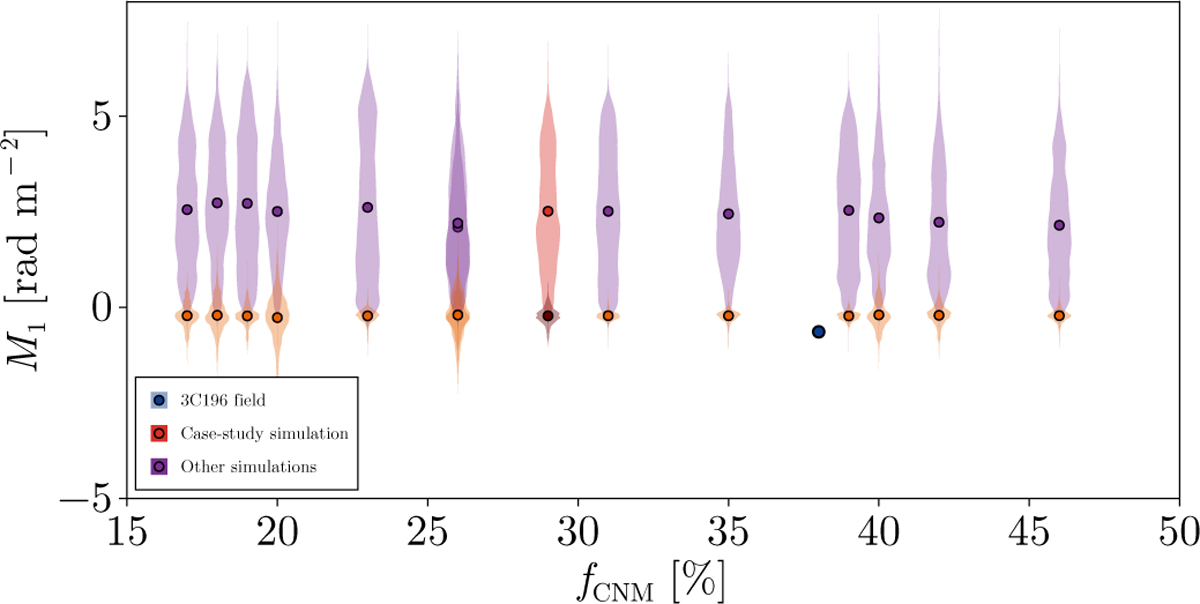
M1 distributions as a function of fCNM for the set of simulations. These distributions are measured along two orthogonal directions: parallel (lighter color) and perpendicular (darker color) to the mean magnetic field. Filled circles indicate the corresponding mean values ⟨M1⟩, outlined in black. The case-study simulation is highlighted in red, while the remaining simulations are shown in violet. Two simulations have fCNM = 26%, leading to an overplotting of their respective distributions. The 3C196 field is displayed in blue witH its associated distribution and mean value.
Current usage metrics show cumulative count of Article Views (full-text article views including HTML views, PDF and ePub downloads, according to the available data) and Abstracts Views on Vision4Press platform.
Data correspond to usage on the plateform after 2015. The current usage metrics is available 48-96 hours after online publication and is updated daily on week days.
Initial download of the metrics may take a while.