Open Access
Fig. 11
Download original image
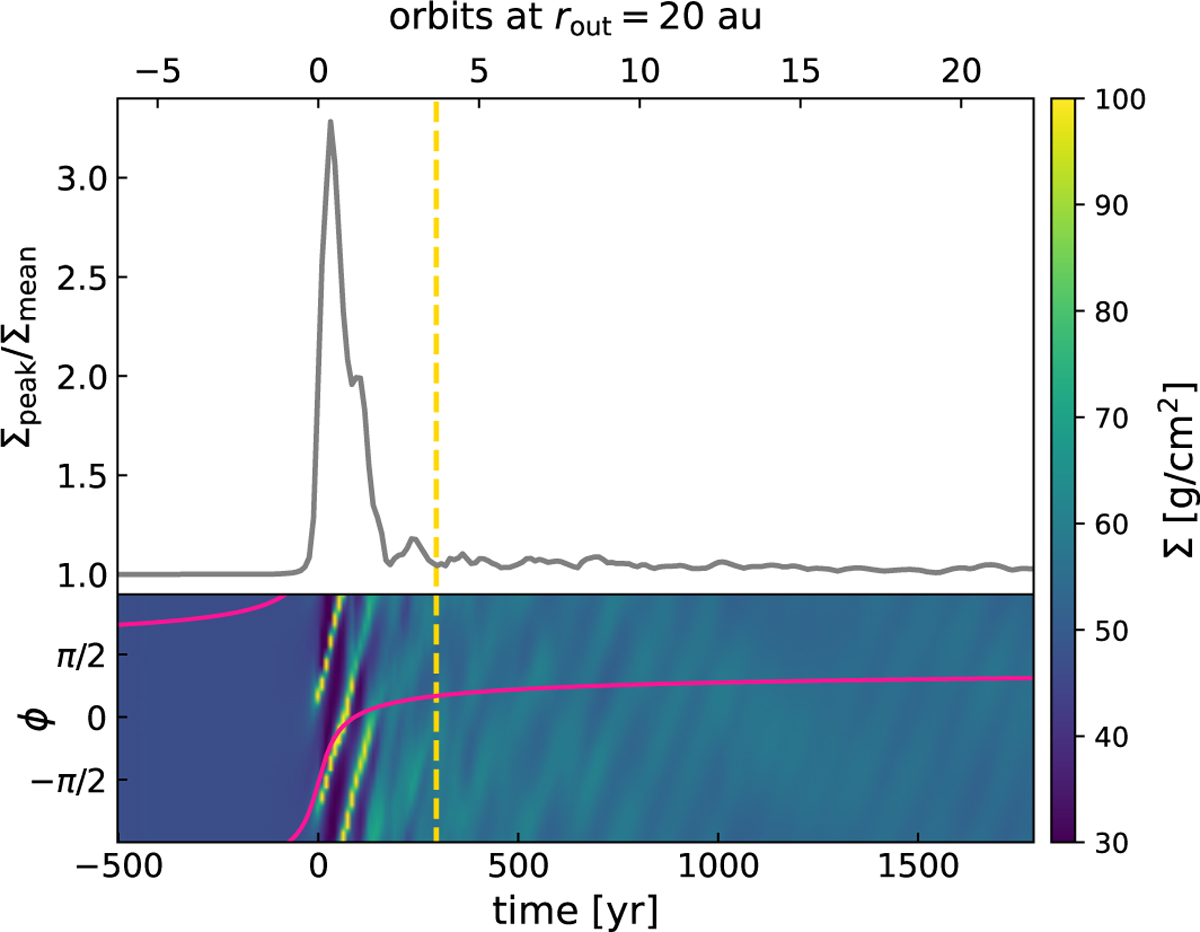
Peak surface density (top panel) and azimuthal profile evolution (bottom panel) of the RW Aur simulation at r = 15 au. As in Figure 8, the pink line indicates the angle to the perturber. The dashed yellow line highlights the current point of time at t = 295 yr after periastron.
Current usage metrics show cumulative count of Article Views (full-text article views including HTML views, PDF and ePub downloads, according to the available data) and Abstracts Views on Vision4Press platform.
Data correspond to usage on the plateform after 2015. The current usage metrics is available 48-96 hours after online publication and is updated daily on week days.
Initial download of the metrics may take a while.