Open Access
Fig. 13
Download original image
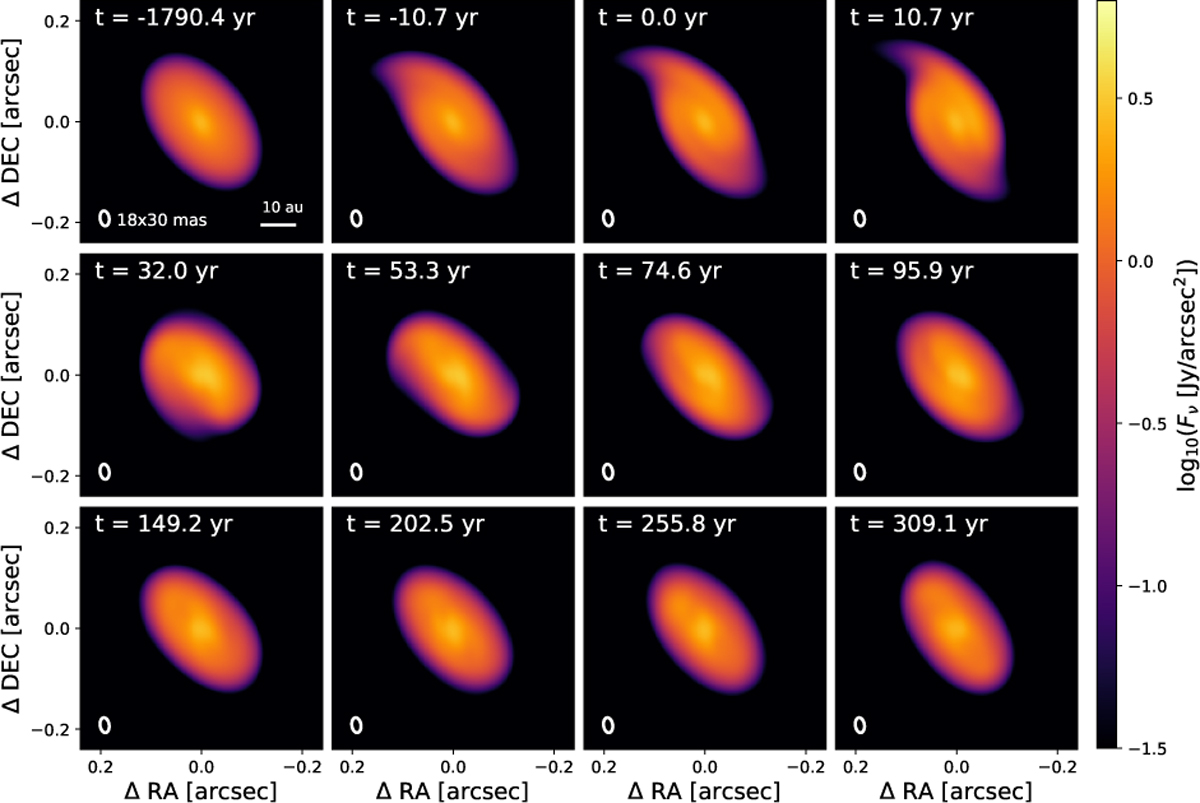
Synthetic observations at λ = 1.3 mm of the RW Aur A simulation at different times. The first panel shows the initial setup of the simulation, time t = 0 yr is the time of the closest approach, and the current time step lies between the second last and last panels. The images were convolved with the same beam as Figure 12.
Current usage metrics show cumulative count of Article Views (full-text article views including HTML views, PDF and ePub downloads, according to the available data) and Abstracts Views on Vision4Press platform.
Data correspond to usage on the plateform after 2015. The current usage metrics is available 48-96 hours after online publication and is updated daily on week days.
Initial download of the metrics may take a while.