Fig. C.1
Download original image
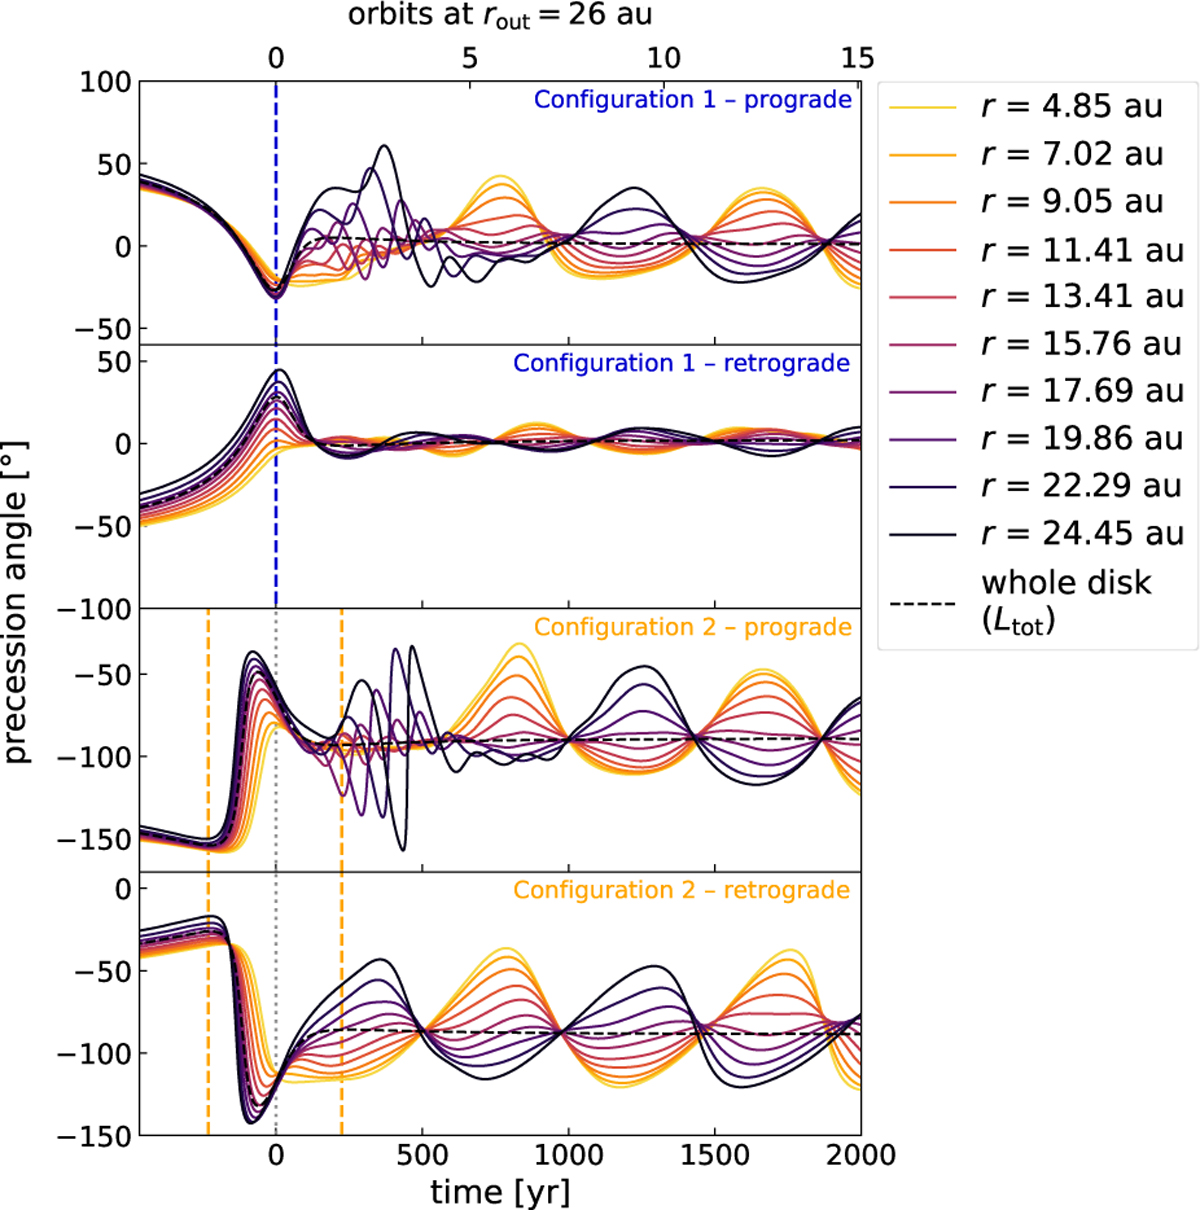
Precession angles for different radii in all four inclined simulations. The black dashed line indicates the precession angle for the total angular momentum vector of the disk. We only show times for where the inclination is ≥ 0.1°, as the precession angle is undefined otherwise. The blue and orange dashed lines highlight the times when the perturber crosses the initial disk midplane. For a good comparison, the range of the y-axis is the same in all panels.
Current usage metrics show cumulative count of Article Views (full-text article views including HTML views, PDF and ePub downloads, according to the available data) and Abstracts Views on Vision4Press platform.
Data correspond to usage on the plateform after 2015. The current usage metrics is available 48-96 hours after online publication and is updated daily on week days.
Initial download of the metrics may take a while.