Open Access
Fig. C.3
Download original image
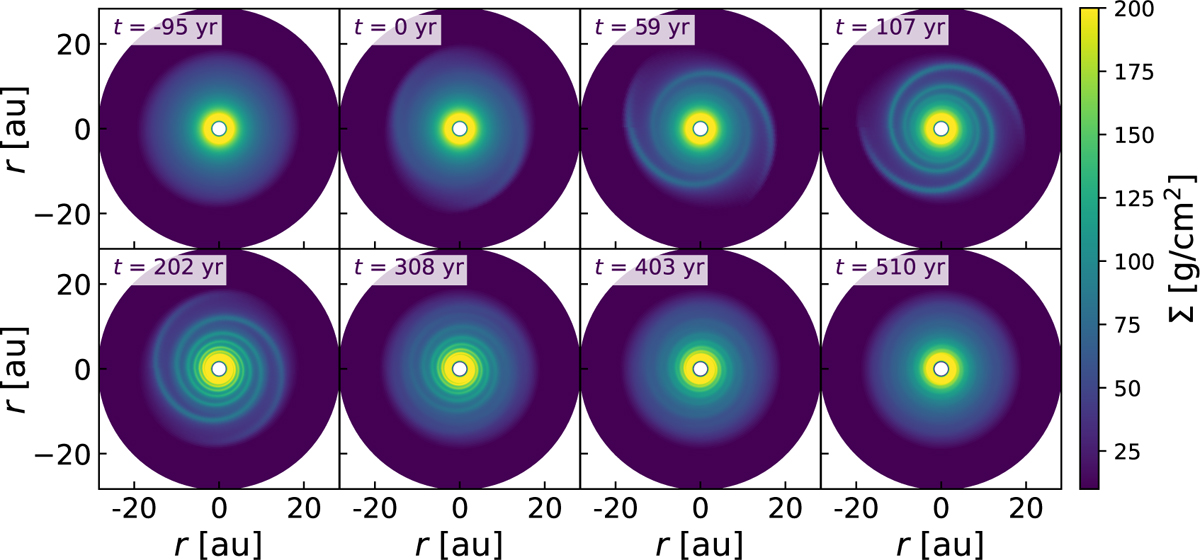
Snapshots of the simulation with an inclined prograde fly-by in Configuration 2 (periastron out of the disk plane). The closest approach occurs at t = 0 yr. The color scale for the surface density is linear, which highlights the spirals better than a logarithmic scale.
Current usage metrics show cumulative count of Article Views (full-text article views including HTML views, PDF and ePub downloads, according to the available data) and Abstracts Views on Vision4Press platform.
Data correspond to usage on the plateform after 2015. The current usage metrics is available 48-96 hours after online publication and is updated daily on week days.
Initial download of the metrics may take a while.