Fig. D.1
Download original image
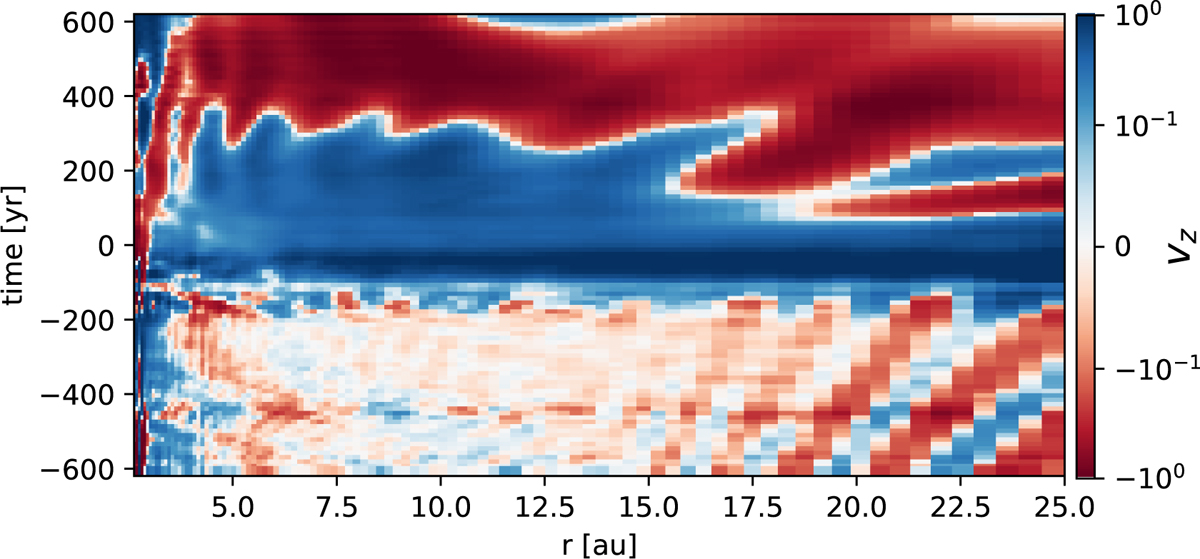
Radial profile of the vertical velocity at θ = 0.15 (at a specific azimuthal location) evolving over time (vertical axis). Time t = 0 yr indicates the point of closest approach of the fly-by. The vertical velocity is normalized by the maximum at each time step, similar to Fairbairn & Ogilvie 2023, Figure 10. We kept the rasterized grid appearance intentionally, as it highlights our resolution in space and time.
Current usage metrics show cumulative count of Article Views (full-text article views including HTML views, PDF and ePub downloads, according to the available data) and Abstracts Views on Vision4Press platform.
Data correspond to usage on the plateform after 2015. The current usage metrics is available 48-96 hours after online publication and is updated daily on week days.
Initial download of the metrics may take a while.