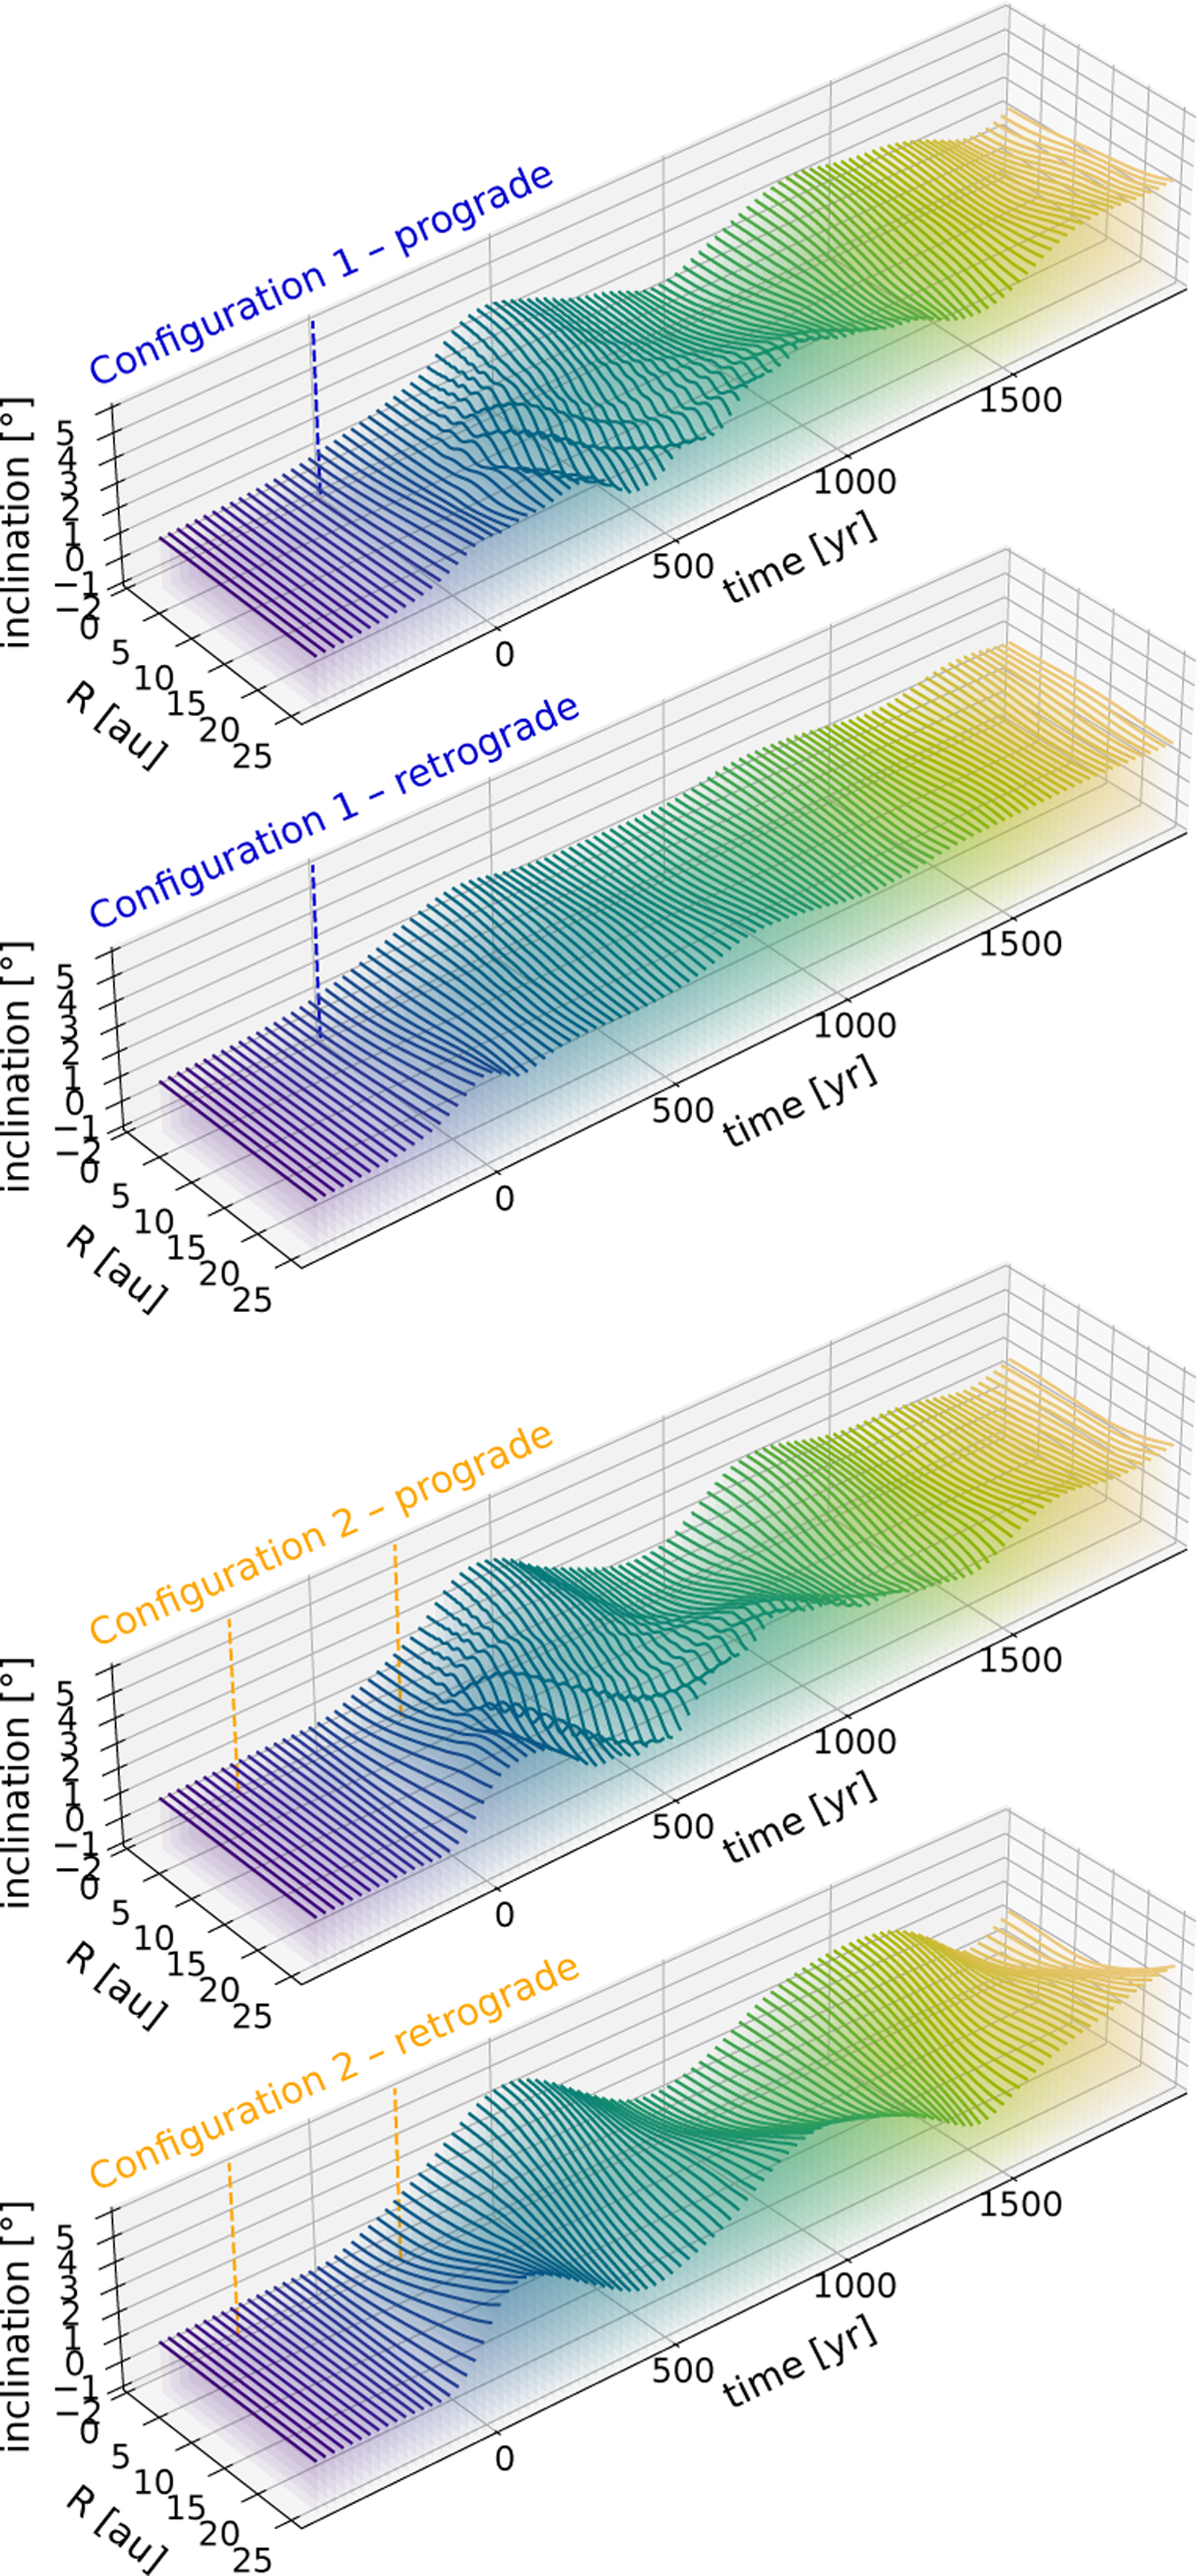
Fig. 3
Download original image
Inclination evolution of the fly-by simulations with the prograde and retrograde fly-by of Configuration 1 (periastron in the same plane as the disk) in the top two panels and Configuration 2 (periastron out of disk plane) in the bottom two panels. Time t = 0 indicates the moment of closest approach. The color corresponds to time, and the blue and orange vertical dashed lines indicate the times when the perturber crosses the (initial) disk midplane. We note that we plot the inclination profile only up to the outer radius of the disk rout = 26 au, but the computational domain extends further out.
Current usage metrics show cumulative count of Article Views (full-text article views including HTML views, PDF and ePub downloads, according to the available data) and Abstracts Views on Vision4Press platform.
Data correspond to usage on the plateform after 2015. The current usage metrics is available 48-96 hours after online publication and is updated daily on week days.
Initial download of the metrics may take a while.