Open Access
Fig. F.4
Download original image
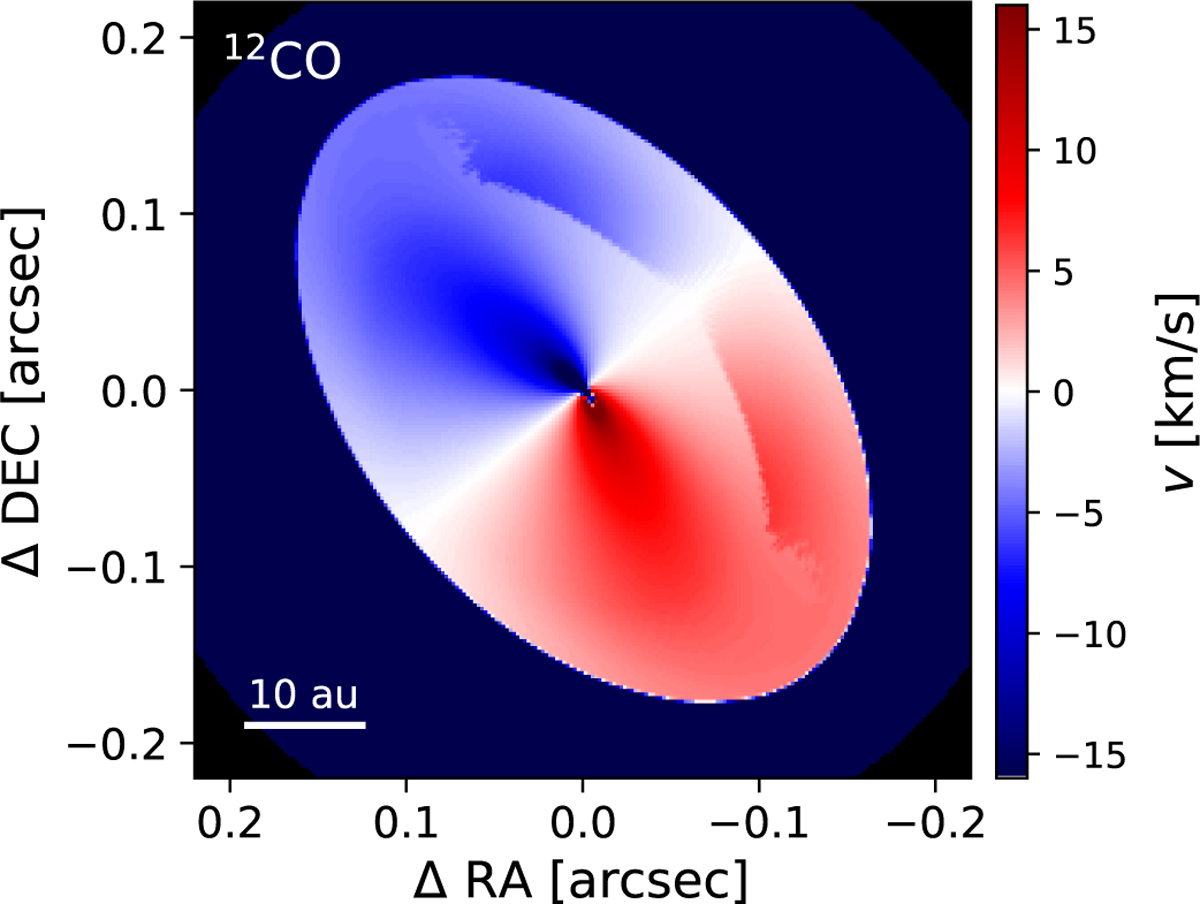
Velocity of the peak intensity of the initial setup of the hydrodynamic simulation of RW Aur A. We note that a part of the backside of the disk is visible at the near side of the disk in the upper right corner of the image.
Current usage metrics show cumulative count of Article Views (full-text article views including HTML views, PDF and ePub downloads, according to the available data) and Abstracts Views on Vision4Press platform.
Data correspond to usage on the plateform after 2015. The current usage metrics is available 48-96 hours after online publication and is updated daily on week days.
Initial download of the metrics may take a while.