Fig. 5
Download original image
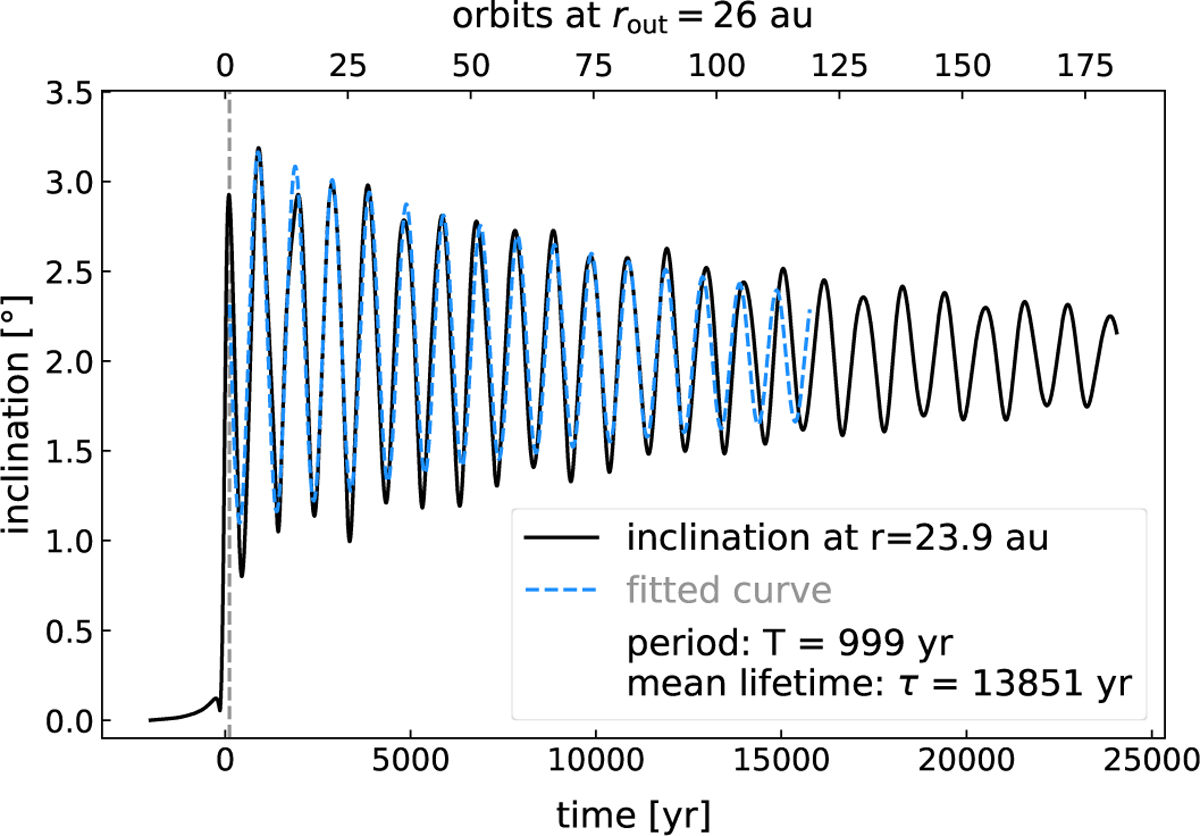
Evolution of the orbital plane at r = 23.9 au in the retrograde simulation in Configuration 2 (see Figure 2, right). We started the fit according to Equation (3) (blue dashed line) at the first maximum of the curve (dashed gray line) and stopped the fit at t = 1.58 × 10⁴ yr, where the period seems to change. We note that this figure shows the evolution over a longer time period than Figure 3.
Current usage metrics show cumulative count of Article Views (full-text article views including HTML views, PDF and ePub downloads, according to the available data) and Abstracts Views on Vision4Press platform.
Data correspond to usage on the plateform after 2015. The current usage metrics is available 48-96 hours after online publication and is updated daily on week days.
Initial download of the metrics may take a while.