Open Access
Fig. 6
Download original image
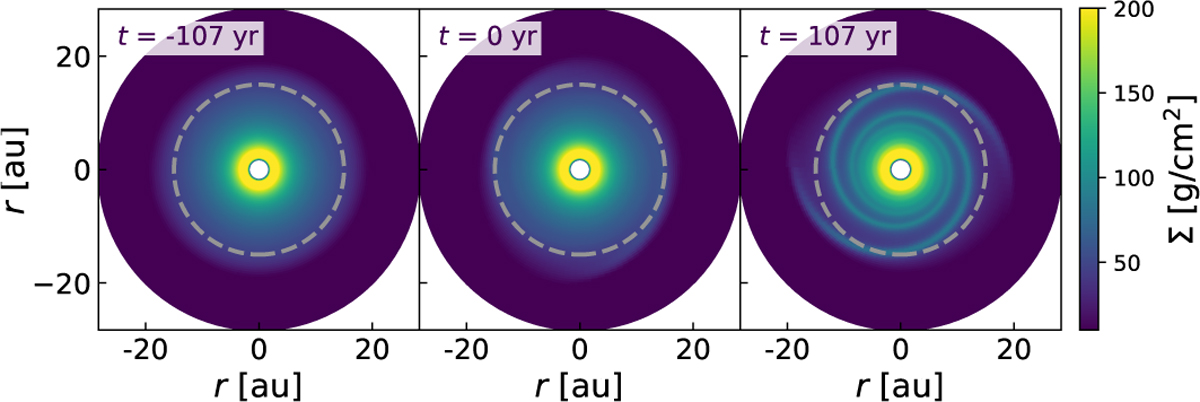
Surface density snapshots of the prograde fly-by in Configuration 2. Time t = 0 yr is the point of the closest approach. The gray dashed circle indicates a radius of 15 au, where we performed further analysis of the spirals. Further snapshots are shown in Appendix C.3.
Current usage metrics show cumulative count of Article Views (full-text article views including HTML views, PDF and ePub downloads, according to the available data) and Abstracts Views on Vision4Press platform.
Data correspond to usage on the plateform after 2015. The current usage metrics is available 48-96 hours after online publication and is updated daily on week days.
Initial download of the metrics may take a while.