Open Access
Fig. 8
Download original image
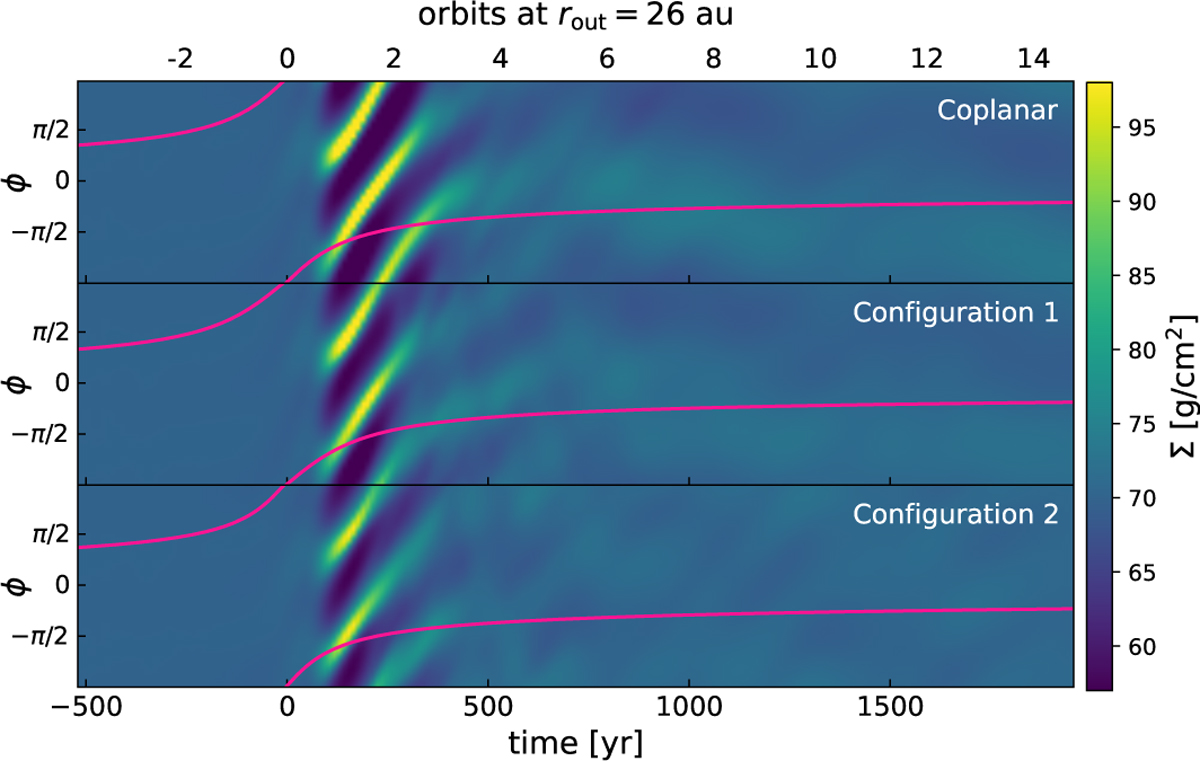
Azimuthal cut of the vertically integrated surface density at r = 15 au for all three prograde simulations. The pink line indicates the angle to the perturber projected to the x–y-plane. The time axis is scaled such that t = 0 yr indicates the point of the closest approach.
Current usage metrics show cumulative count of Article Views (full-text article views including HTML views, PDF and ePub downloads, according to the available data) and Abstracts Views on Vision4Press platform.
Data correspond to usage on the plateform after 2015. The current usage metrics is available 48-96 hours after online publication and is updated daily on week days.
Initial download of the metrics may take a while.