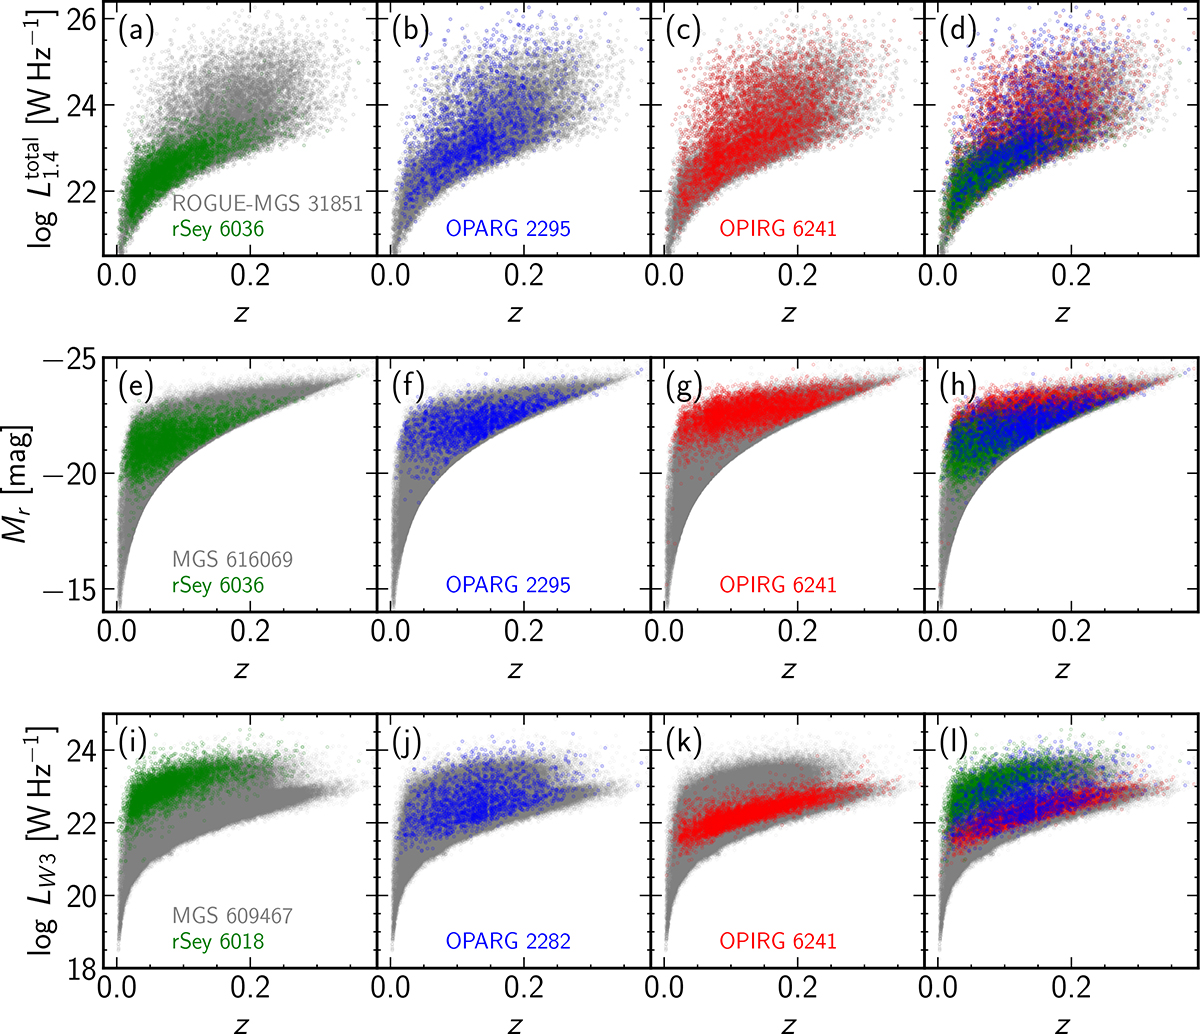
Fig. 3.
Download original image
Total radio luminosity (a)–(d), absolute magnitude in the r band (e)–(h), and mid-infrared W3 luminosity (i)–(l) as a function of redshift. Colours indicate the samples: radio Seyferts are in green, OPARGs in blue, and OPIRGs in red. The grey points indicate the parent samples: ROGUE I & II SDSS MGS (‘ROGUE-MGS’) for the first row, SDSS MGS (‘MGS’) for the second and third rows. Numbers on the panel show the count of objects. Subsamples are shown overplotted on the parent sample on the first three columns; parent samples plus all subsamples are show together on the last column for comparison.
Current usage metrics show cumulative count of Article Views (full-text article views including HTML views, PDF and ePub downloads, according to the available data) and Abstracts Views on Vision4Press platform.
Data correspond to usage on the plateform after 2015. The current usage metrics is available 48-96 hours after online publication and is updated daily on week days.
Initial download of the metrics may take a while.