| Issue |
A&A
Volume 708, April 2026
|
|
|---|---|---|
| Article Number | A27 | |
| Number of page(s) | 10 | |
| Section | Extragalactic astronomy | |
| DOI | https://doi.org/10.1051/0004-6361/202557370 | |
| Published online | 26 March 2026 | |
Implications of the continuous radio-loudness distribution among active galactic nuclei in the local Universe
1
Department of Theoretical Physics and Astrophysics, Faculty of Science, Masaryk University, Kotláršká 2 Brno, 61137, Czechia
2
Departamento de Física–CFM, Universidade Federal de Santa Catarina, C.P. 5064, 88035-972, Florianópolis, SC, Brazil
3
Astronomical Observatory, Jagiellonian University, ul. Orla 171, PL-30244 Kraków, Poland
4
LUX, Observatoire de Paris, Université PSL, Sorbonne Université, CNRS, 92190, Meudon, France
★ Corresponding author: This email address is being protected from spambots. You need JavaScript enabled to view it.
Received:
22
September
2025
Accepted:
20
January
2026
Abstract
Aims. We investigate the radio loudness (ℛ) distribution in a large, homogeneous sample of radio galaxies.
Methods. The sample is composed of galaxies from the ROGUE I/II catalogue that belongs to the SDSS main galaxy sample and is divided into optically inactive radio galaxies (OPIRGs), optically active ones (OPARGs), and ’radio Seyferts’. We used optical, mid-infrared, and radio data to calculate the active galactic nucleus bolometric luminosities, accretion rate (λ), black-hole mass (MBH), and ℛ.
Results. Contrary to some previous studies based on restricted samples, using our complete sample of objects with redshifts z < 0.4, we find no evidence of bimodality in ℛ. The highest ℛ values are associated with extended radio structures. We find that ℛ is anti-correlated with λ, and spans ∼2 dex at fixed λ. Radio Seyferts, OPARGs, and OPIRGs form a sequence of increasing MBH with substantial overlap. Radio Seyferts show no correlation ℛ–MBH, whereas OPARGs and OPIRGs show a weak positive trend. From theoretical considerations, the observed ∼2-dex spread in radio luminosity and ℛ can be reproduced by only an approximately four-fold variation in the dimensionless magnetic flux φ assuming realistic black-hole spins.
Conclusions. The smooth distribution of radio loudness supports a common evolutionary path for all radio sources, with black-hole spin and magnetic field varying continuously. The radio loudness depends on black-hole mass and accretion rate, while moderate variations in φ may account for the observed scatter in this relation.
Key words: methods: observational / galaxies: active / galaxies: evolution / galaxies: jets / radio continuum: galaxies
© The Authors 2026
 Open Access article, published by EDP Sciences, under the terms of the Creative Commons Attribution License (https://creativecommons.org/licenses/by/4.0), which permits unrestricted use, distribution, and reproduction in any medium, provided the original work is properly cited.
This article is published in open access under the Subscribe to Open model. This email address is being protected from spambots. You need JavaScript enabled to view it. to support open access publication.
1. Introduction
Active galactic nuclei (AGNs) span a wide range of accretion rates that are reflected in the large spread of optical emission from their accretion flows and discs. They also show significant differences in radio emission, which is associated with relativistic jets and outflows launched by the central engine (see e.g. Tadhunter 2016; Hardcastle & Croston 2020; Saikia 2022, for a review). Notably, even among sources with comparable accretion rates, the efficiency of radio production can differ by several orders of magnitude.
To quantify this efficiency, Kellermann et al. (1989) introduced the radio-loudness parameter, denoted here by  , which is defined as the ratio of 5 GHz radio to optical B-band flux density. This parameter has since been widely applied to different AGN classes (e.g. Sikora et al. 2007; Rafter et al. 2009; Singh & Chand 2018; Rusinek et al. 2020) as a proxy for jet production efficiency, under the assumption that radio emission traces jets and that optical light is dominated by the accretion disc. These assumptions are generally valid for luminous quasars, but not always for lower-luminosity AGNs and quasars. For example, in Seyfert galaxies, particularly those accreting at sub-Eddington rates, the host galaxy can contribute significantly to the observed optical flux, alongside the AGN emission (see e.g. Ho & Peng 2001). Likewise, star formation processes may contribute to, or even dominate, the radio emission rather than jets. Even in quasars with very low radio luminosities, star formation may outshine jet-related radio output (Kellermann et al. 2016; Rankine et al. 2021). The original definition of the radio-loudness parameter may thus not be directly applicable in all cases and warrants careful consideration.
The distribution of radio loudness has been a subject of debate for decades. Kellermann et al. (1989) argued for a bimodal distribution in quasars, with radio-loud and radio-quiet populations separated at ℛK = 10. Later studies revisited this claim with mixed results, some supporting a dichotomy (see e.g. Ivezić et al. 2002; Sikora et al. 2007; Rafter et al. 2009; Rusinek et al. 2020) and others attributing the apparent bimodality to selection effects and flux limits (see e.g. Mahony et al. 2012; Singal et al. 2013; Macfarlane et al. 2021, and references therein).
While the question of radio-loudness bimodality remains unsettled for quasars, it is clear that their radio-loudness distribution is broad, spanning several orders of magnitude. The radio-loudness parameter has been extensively studied in the literature for all types of AGNs (e.g. Miller et al. 1990; White et al. 2000, 2007; Sikora et al. 2007; Rafter et al. 2009; Singal et al. 2013; Rusinek et al. 2020), with entirely different conclusions about its distribution. It was suggested that radio-loud and radio-quiet sources may have different evolutionary paths or different jet production mechanisms (Bicknell 2002).
Much less is known about radio loudness in AGNs that accrete below the Eddington limit, such as Seyfert galaxies and low luminosity radio galaxies. Several works have pointed out systematic differences: Seyferts, which are typically found in spiral and lenticular hosts, never reach the high radio-loudness values observed in radio galaxies, which are usually associated with ellipticals (Xu et al. 1999; Sikora et al. 2007; Kozieł-Wierzbowska et al. 2017; Zheng et al. 2020). Moreover, Seyferts and radio galaxies follow a similar overall anti-correlation between ℛK and the Eddington ratio λ (i.e. the ratio of total radiative output to the Eddington luminosity for the accreting black hole), but the separation in the ℛK–λ plane between them cannot be explained solely by selection effects. If very radio-loud Seyferts with ℛK > 104 existed, they should be detectable, yet none are observed.
Progress therefore requires large and homogeneous samples of non-quasar AGNs, with careful treatment of host-galaxy contamination in both the radio and optical bands, to establish the true shape of the radio-loudness distribution and its dependence on the accretion rate and host properties. Unlike previous works, we present a study of the radio loudness in galaxies in the local Universe with low to moderate accretion rates. We selected these galaxies from the catalog of Radio Sources Associated with Optical Galaxies and Having Unresolved or Extended Morphologies (ROGUE) I and II (Kozieł-Wierzbowska et al. 2020; in prep.) that belong to the main galaxy sample of the Sloan Digital Sky Survey (SDSS; York et al. 2000). Our sample is homogeneously selected with both optical and radio flux limits well defined, and contains Seyfert galaxies as well as optically active radio galaxies (OPARGs) and optically inactive radio galaxies (OPIRGs), whose redshifts (z) are in the 0.002 ≤ z ≤ 0.4 range. The sample and its selection effects are described in Sect. 2. The construction of this catalogue results in the exclusion of broad line radio galaxies. Such a sample allows us to study the radio-loudness distribution and its implications for the evolution of extragalactic radio sources in the current epoch (see Sect. 3). Throughout this work, we adopt a cosmology with H0 = 70 km s−1 Mpc−1, ΩM = 0.30, and ΩΛ = 0.70.
2. Data
2.1. Sample selection
2.1.1. Datasets and parent sample
We briefly summarize the optical, mid-infrared (MIR), and radio datasets used in this work, as well as our parent sample, which is the same as the one by Stasińska et al. (2025). We selected galaxies from the main galaxy sample (MGS; Strauss et al. 2002)1 of the SDSS Data Release 7 (DR7; Abazajian et al. 2009). We only retained galaxies whose redshifts (z) are in the 0.002 ≤ z ≤ 0.4 range, to avoid luminosity distances being dominated by peculiar motions (Ekholm et al. 2001) and to ensure that the Hα emission line falls into the SDSS spectral range. The Hα line is essential for the classification of radio galaxies into OPARGs or OPIRGs, as explained by Stasińska et al. (2025). We also only selected galaxies with a signal-to-noise ratio ≥ 10 in the continuum at 4020 Å, to be able to safely derive their properties from their spectra.
Optical spectral data were taken from the STARLIGHT database (Cid Fernandes et al. 2005). Black-hole masses (MBH) were derived from stellar velocity dispersions measured by STARLIGHT using the Tremaine et al. (2002) relation. Stellar masses (M★) were obtained via STARLIGHT’s inverse population synthesis applied to restframed SDSS fibre spectra, then corrected to total galaxy values using z-band photometry. Star formation rates (SFR) over the past 100 Myr were estimated by summing the stellar masses of populations younger than this age and dividing by the time span, following Asari et al. (2007, Eq. (10)). We excluded a small fraction (< 0.3%) of galaxies with M★ ≤ 107 M⊙ or non-positive values of ‘petroR50’, which are the 50 percent Petrosian light radii in the r band as available from the SDSS DR7 database. Our MGS parent sample after the redshift and quality cuts is comprised of 616 069 objects.
Mid-infrared data were obtained by matching sources in the Wide-field Infrared Survey Explorer (WISE; Wright et al. 2010) and SDSS DR7 galaxies within 1 arcsecond. The 12 μm luminosities (W3) were calculated assuming a constant power-law spectra (i.e. Fν ∼ ν0 = constant) as in Kozieł-Wierzbowska et al. (2021, Sect. 2.3).
Radio data for our targets were taken from the ROGUE I and II catalogues (Kozieł-Wierzbowska et al. 2020; in prep.), which are based on SDSS DR7 galaxies with the continuum signal-to-noise ratio cut of 10. Radio counterparts were looked for in the First Images of the Radio Sky at Twenty cm (FIRST; White et al. 1997) and the National Radio Astronomy Observatory Very Large Array (NRAO VLA Sky Survey (NVSS; Condon et al. 1998) radio catalogues. ROGUE I contains those targets for which FIRST detects a compact core, while ROGUE II includes systems whose radio counterparts do not possess a core-like structure. Both catalogues provide 1.4 GHz radio fluxes and visual classifications of radio and optical morphologies. Total monochromatic 1.4 GHz radio luminosities (L1.4total) were calculated assuming a spectral index of 0.75, as in Kozieł-Wierzbowska et al. (2021, Eq. (1)). Sources whose radio morphology from ROGUE I & II is classified as B (‘blended’) or ND (‘not detected’) were excluded. Our ROGUE I & II SDSS MGS parent sample is comprised of 31 851 galaxies.
2.1.2. Subsamples
Following Stasińska et al. (2025), we defined subsamples of 2468 OPARGs and 14 082 OPIRGs based on a 3 Å threshold in Hα equivalent width, W(Hα). Both types are located on the ‘radio-AGN’ side in the Dn(4000) versus L1.4total/M★ (DLM) diagram (Kozieł-Wierzbowska et al. 2021), where Dn(4000) is the 4000 Å break from synthetic spectra (e.g., Stasińska et al. 2006) and L1.4total/M★ is the quotient between the total luminosity at 1.4 GHz and the stellar mass obtained by STARLIGHT. Additionally, OPARGs must lie to the right of the Stasińska et al. (2006) division in the [N II]λ6584/Hα versus [O III]λ5007/Hβ (BPT; Baldwin et al. 1981) diagram2, i.e. they must be classified as galaxies that host an optical AGN. For OPIRGs, if they show emission lines, the W(Hα) < 3 Å criterion indicates that the emission is not due to an AGN, but to ionization by hot low-mass evolved stars (HOLMES) present in the galaxy (see Stasińska et al. 2008, 2025).
We also considered a third subsample of 10 311 dubbed ‘radio Seyfert galaxies’ constituted by sources in the ROGUE I and II catalogues lying in the star-forming region of the DLM diagram, but are located to the right of the Stasińska et al. (2006) line on the BPT, and with W(Hα) > 3 Å. The flowchart in Fig. 1 shows the criteria used to define our subsamples, while Fig. 2 shows our subsamples on the DLM, BPT, and W(Hα) versus [N II]/Hα (WHAN) planes.
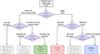 |
Fig. 1. Flowchart detailing our sample selection. Retired galaxies are galaxies that have stopped forming stars and are ionized by their populations of HOLMES (see: Stasińska et al. 2008). Similarly to the star-forming galaxies, they are not relevant for the present study. The parent ‘ROGUE I & II SDSS MGS’ sample already incorporates redshift range limits, optical spectral quality cuts, and removal of sources whose radio morphology is blended or non-detected. The number of sources in each subsample is given in the panels. Numbers in brackets show number counts before applying limits to the S/N of [O III] or W3 luminosities, to emission line detection, and to the star-formation-corrected radio luminosity values. |
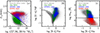 |
Fig. 2. Diagrams showing the loci of our radio Seyfert (green), OPARG (blue), and OPIRG (red) subsamples in relation to our parent samples: ROGUE I & II SDSS MGS (‘ROGUE-MGS’) for panel (a), SDSS MGS (‘MGS’) for panels (b) and (c) (grey points). (a) Dn(4000) versus L1.4/M★ (DLM) plane. The dashed line by Kozieł-Wierzbowska et al. (2021) separates radio emission dominated (top) or not (bottom) by AGN. (b) [O III]λ5007/Hβ versus [N II]λ6584/Hα (BPT) plane. The dashed line by Stasińska et al. (2006) separates galaxies ionized by star formation alone (left) from those ionized by a hard ionizing radiation field (right). OPIRGs are not shown since they have not been selected based on this diagram. (c) W(Hα) versus [N II]λ6584/Hα (WHAN) plane. The dashed line shows the W(Hα) = 3 Å criterion by Cid Fernandes et al. (2011) to separate ionization by HOLMES (bottom) from ionization by other sources (top). OPIRGs that lack [N II] detection are not shown on this plane. |
2.1.3. Derived data
In the following we describe the calculated quantities used in this work. We fitted an empirical linear relation between log L1.4total and logSFR for star-forming (SF) galaxies (i.e. those classified as SF in both the DLM and BPT diagrams) following Murphy et al. (2011). This was used to subtract the contribution of star formation to the radio emission, and yielded star-formation-corrected L1.4 values for all sources. The fractional star formation contribution f to L1.4total is only substantial for radio Seyferts, with a median value of f = 0.36 and interquartile range of 0.18–0.59. This allows us to analyse radio Seyferts alongside radio galaxies where L1.4total is dominated by AGNs. The correction is roughly on the order of 1% for OPARGs and OPIRGs. Hereafter, L1.4 is used to represent the star-formation-corrected values.
For OPARGs and radio Seyfert galaxies, bolometric luminosities (Lbol) were derived from [O III] luminosities using the Stasińska et al. (2025, Eq. (2)) relation. This relation results from a series of photoionization models whose ionizing sources have spectral energy distributions (SEDs) based on the observed continua of unobscured Type I AGNs in the optical and X-rays (Jin et al. 2012, 2018). In addition, we require a S/N ≥ 3 in [O III] fluxes.
For OPIRGs, we used the type 2 AGN relation between the nuclear 12 μ luminosity and Lbol by Spinoglio et al. (2024, Table 5). Since the nuclear 12 μ luminosity is not available for most of our objects, we used the WISE W3 luminosity as a surrogate and kept in mind that the WISE measurements are affected by the contribution of the underlying galaxy. The latter, however, is expected to be small since OPIRGs experience little – if any – star formation. Only objects with S/N ≥ 3 in W3 were kept.
Eddington ratios are computed as λ = Lbol/LEdd, with LEdd = 1.3 × 1031 (MBH/M⊙) W. In this paper, radio loudness is defined as the ratio of the radio 1.4 GHz monochromatic luminosity to the bolometric AGN disc luminosity, ℛ = ν1.4L1.4/Lbol. The Kellermann et al. (1989) definition of radio loudness is therefore approximately ℛK ≃ 106 ℛ, assuming that the average spectral index of the radio continua is α = 0.8, and that the B-band luminosity constitutes roughly 10% of the bolometric luminosity of the AGN disc. Hence the radio-loud threshold of ℛK = 10 translates to logℛ = −5 in our convention.
For clarity, when we use Lbol estimated from [O III], which applies to the OPARG and radio Seyfert subsamples, we use the canonical symbols λ and ℛ. When we mix Lbol estimated from either [O III] or W3 (for OPIRGS), we denote those parameters Lbol′, λ′, and ℛ′ to indicate they are based on a heterogeneous set of observational parameters. We compare Lbol for OPARGS using both [O III] and W3 and find a good agreement, so the values are internally consistent.
In the rest of the paper, we only show objects for which Lbol′, λ′, and ℛ′ can be calculated after the S/N cuts in either [O III] or W3 luminosities. We exclude sources for which the star-formation-corrected radio-luminosities values are below the lowest L1.4total value in the ‘ROGUE-MGS’ sample, i.e. those with L1.4 < 1020 W Hz−1. Radio Seyferts and OPARGs are also required to have all BPT emission lines ([O III]λ5007, Hβ, [N II]λ6584, Hα) detected. Our final subsamples are thus comprised of 5974 radio Seyferts, 4825 OPIRGs, and 1958 OPARGs, as shown in Figs. 1 and 2a.
2.2. Impact of flux limits on subsamples
Our ROGUE-MGS parent sample is subject to both optical and radio flux limits. The SDSS MGS consists of galaxies with r-band Petrosian magnitudes ≤17.77 and r-band Petrosian half-light surface brightnesses ≤24.5 mag arcsec−2, with the latter cut removing only 0.1% of the objects (Strauss et al. 2002). Strauss et al. (2002) show that overall the MGS is ∼95% complete. Radio observations at 1.4 GHz have a flux limit of 1 mJy for point sources (with synthesized beams of 5 4 for FIRST and 45″ for NVSS; see Kozieł-Wierzbowska et al. 2020).
Figure 3 shows L1.4total, the absolute optical r-band magnitude (Mr) and the mid-infrared W3 luminosity (LW3) versus redshift for our parent samples and subsamples. Panels (a) to (d) of Fig. 3 make it evident that radio Seyfert galaxies are most significantly affected by the radio flux limit, likely with some fraction of the source population being undetected, as seen from the concentration of these sources near the lower edge of the ROGUE-MGS points. The population of OPARGs and OPIRGs are much less severely affected. We also note that the ROGUE-MGS parent sample and all subsamples show the same lower envelope of radio luminosity with redshift due to flux limits, indicating no faint-end bias.
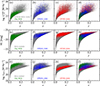 |
Fig. 3. Total radio luminosity (a)–(d), absolute magnitude in the r band (e)–(h), and mid-infrared W3 luminosity (i)–(l) as a function of redshift. Colours indicate the samples: radio Seyferts are in green, OPARGs in blue, and OPIRGs in red. The grey points indicate the parent samples: ROGUE I & II SDSS MGS (‘ROGUE-MGS’) for the first row, SDSS MGS (‘MGS’) for the second and third rows. Numbers on the panel show the count of objects. Subsamples are shown overplotted on the parent sample on the first three columns; parent samples plus all subsamples are show together on the last column for comparison. |
Panels (e)–(h) of Fig. 3 show Mr versus z. The lower envelope for the parent sample is given by the SDSS optical flux limit, while the extra Mr cut in the subsamples is a consequence of the radio flux limit. This effectively excludes r-band faint sources, whose emission is more likely dominated by star formation rather than AGN activity (Capetti et al. 2022; Wójtowicz et al. 2023). We also see that OPIRGs are dominated by the brightest galaxies in the sample at all redshifts; Seyfert galaxies are comprised of the faintest galaxies in the sample of radio-detected MGS sources; and OPARGs are in between OPIRGs and Seyfert sources. Optically faint galaxies (greater Mr values) drop out at higher redshifts due to the flux limit, while the brightest galaxies (Mr ∼ −24), though included, are intrinsically rare due to the steep decline of the luminosity function at high luminosities (Im et al. 1996; Ermash 2013). Panels (i) to (l) of Fig. 3 show LW3 as a function of z. Some radio Seyferts and OPARGs are absent in those panels due to missing W3 data. However, W3 is only used to calculate Lbol for OPIRGs, which lie away from both the lower envelope and the bright cloud of the parent MGS distribution.
Although low radio-luminosity objects may be under-represented, the radio-detected sources in our sample provide good coverage at the high radio-luminosity end. This regime matches the radio-loudness range investigated in previous studies and is most relevant for examining the radio-loudness distribution. The radio-luminosity function is expected to decline at the faint end ( ), which means that our sample effectively captures the bulk of the population.
3. Discussion
3.1. No bimodality in the radio-loudness distribution
Figure 4 shows 2D histograms of log ℛ versus log λ, together with 1D histograms for radio loudness. Panel (a) shows the radio loudness and the Eddington ratio for OPARG and radio Seyfert objects only, for which bolometric luminosities are based on photoionization models with AGN SEDs (see Sect. 2.1.3). Panel (b) includes OPIRGS, for which bolometric luminosities are inferred from W3 luminosities. The 2D histograms are proportional to the logarithm of the number of objects in each bin.
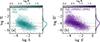 |
Fig. 4. Two-dimensional histograms of radio loudness (ℛ) versus Eddington ratio (λ) for radio Seyfert and OPARG objects (a) and radio Seyfert, OPARG, and OPIRG objects combined (b). Bin colours represent the logarithm of the number of objects, as indicated by the colour bars. Marginal 1D histograms of radio loudness are shown on the right-hand side of each panel. Values with and without a prime indicate Lbol derived solely from [O III] or from a mix of [O III] (for OPARG and Seyfert) and W3 (for OPIRG) luminosities, respectively. The number of objects is indicated in each panel. The dashed line corresponds to the classical radio-loudness threshold of Kellermann et al. (1989), and the dotted line to the division from Gupta et al. (2018); both are shown using our convention. No bimodality is seen in either the 1D or 2D histograms. |
We find no evidence of discontinuity in either the 2D or the 1D histograms. Thus no bimodality is seen in the radio-loudness distribution. Our subsamples cover the same radio-loudness range at the regime where previous studies have reported bimodality using a mixed sample of narrow- and broad-line galaxies (log ℛ ∼ −6 to −2, corresponding to  ), which indicates that this continuous distribution reflects the intrinsic nature of the AGN population accreting at lower to moderate accretion rates, in the local Universe rather than selection effects.
3.2. Physical drivers of radio loudness in AGN
In Fig. 5 we present the distribution of the radio-loudness parameter as a function of the Eddington ratio for different subsamples. On the right-hand side of each panel we also show the projected 1D histogram for log ℛ for each subsample. The majority of our sources accrete at a moderate-to-low rate (log λ < −2), within the range where radiatively inefficient accretion flows are expected to form. However, it should be noted that radio Seyferts and OPARGs extend up to log λ ≲ 0, i.e. into the regime that allows for the formation of standard geometrically thin, optically thick (Shakura–Sunyaev) accretion discs.
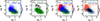 |
Fig. 5. Scatter plots of radio loudness (ℛ) versus Eddington ratio (λ) for different subsamples: radio Seyfert and OPARG (a); radio Seyfert and extended sources (b); radio Seyfert, OPARG, and OPIRG (c); and by optical morphology: spiral, lenticular, and elliptical (d). Extended sources are those classified with radio morphologies FRI, FRII, FRI/II, OI, OII, Z, X, DD, WAT, NAT, or HT in the ROGUE catalogues. Subsample sizes are indicated in each panel. Marginal 1D histograms of radio loudness for each subsample are shown on the right-hand side of each panel. Reference lines and primed and unprimed quantities are as in Fig. 4. |
In Fig. 5a we see that the radio Seyferts and OPARGs, i.e. the two subsamples with accretion-related luminosities robustly derived from line emission, form a continuous distribution, characterized by a general anti-correlation in the λ–ℛ plane, albeit with a significant spread. Specifically, for a given value of the Eddington ratio within the range −4 < log λ < −1, the values of ℛ span about two orders of magnitude. Moreover, the radio Seyfert and OPARG subsamples largely overlap, with the exception of a small number of OPARGs that reach the highest values of radio loudness.
Figure 5b shows that extended sources are concentrated in the high-ℛ tail of the OPARGs. In other words, radio-compact galaxies (i.e. unresolved in NVSS and FIRST) are indistinguishable from radio Seyferts in the λ–ℛ plane, while only radio galaxies with extended radio structures reach much higher values of ℛ. Compact radio galaxies are generally excluded from population studies, as their identification is non-trivial. Most work therefore focuses on the ‘classical’ extended FR I and FR II sources, which leads to an apparent bimodality in the radio-loudness distribution: extended radio galaxies appear more radio loud than radio Seyferts at a given Eddington ratio (see e.g. Sikora et al. 2007). Our results show, however, that most radio galaxies are compact with moderate ℛ values, with only a minority having extended structures and high radio loudness. When these compact galaxies are taken into account, the apparent bimodality between radio Seyferts and radio galaxies disappears.
Figure 5c shows that OPIRGs, i.e. radio galaxies that lack prominent optical signatures of central activity, have the lowest accretion rates (log λ < −3). The wider ∼3 dex spread in ℛ for OPIRGs may arise from deriving Lbol from W3, as the AGN power can be overestimated due the contribution from the stellar populations of the galaxies to the W3 band. Considering all three subsamples together, the Spearman correlation coefficient between  and y = log λ′ is ρxy = −0.638, −0.499 for radio Seyferts, −0.331 for OPARGs, and −0.128 for OPIRGs. To account for the ℛ and λ shared dependence on Lbol, we computed the partial correlation coefficient ρxy|z controlling for z = log Lbol′ (see e.g. Eq. (1) in Wild et al. 2025). For all subsamples taken together, ρxy|z = −0.636, −0.234 for radio Seyferts, −0.293 for OPARGs, and −0.196 for OPIRGs. Thus the anti-correlation between ℛ and λ remains even after accounting for the effect of Lbol.
Figure 5d shows that, when host morphology is considered, a stronger contrast between high- and low-ℛ sources emerges. Spiral and lenticular galaxies, predominantly hosting radio Seyferts and some OPARGs, lie in the lower-right region (lower ℛ, higher λ) and exhibit a clear λ–ℛ anti-correlation. Ellipticals, hosting OPIRGs and most OPARGs, instead form a broad, featureless distribution at low λ and mid-to-high ℛ.
Figure 6 shows our subsamples in different MBH versus luminosities or luminosity versus luminosity planes. In panel (a) we see that Seyfert galaxies are found in systems with relatively low black-hole masses and low radio luminosities. OPIRGs are associated with the most massive black holes and represent the most radio-luminous objects in our sample. OPARGs occupy an intermediate regime, typically hosting intermediate black-hole masses, while their radio luminosities can extend up to the ranges observed in OPIRGs.
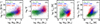 |
Fig. 6. (a) SF-corrected radio luminosity. (b) Radio loudness. (c) Bolometric luminosity versus black-hole mass. (d) Radio luminosity as a function of bolometric luminosity. (e) Radio size (measured from FIRST) as a function of black-hole mass. All panels show radio Seyferts, OPARGs, and OPIRGs (sample sizes in legends). |
In Fig. 6b we show ℛ as a function of MBH. A saturation in radio loudness is clearly evident for Seyfert galaxies, with OPIRGs again occupying the upper corner of the plot, characterized by higher black-hole masses and higher radio luminosities than Seyferts. However, no clear separation is observed: OPARGs populate the intermediate region between OPIRGs and Seyferts, which shows some indication of a correlation between MBH and radio loudness.
As shown in Fig. 6c, the bolometric accretion-related luminosities of our sources span a range of only about two orders of magnitude. In contrast, Fig. 6d shows that for any given bolometric luminosity, the corresponding radio luminosity extends across nearly four to five orders of magnitude. The broad spread in the data results from three distinct clouds of points corresponding to radio Seyferts, OPARGs, and OPIRGs, with each cloud concentrated at progressively higher radio luminosities. The comparatively narrow range in bolometric output and the wider dispersion in radio power highlight that the radio-loudness parameter is primarily driven by variations in radio luminosity rather than bolometric luminosity.
Here we note that the observed distributions presented in Figs. 5 and 6 accurately reflect the actual distribution of sources within the considered redshift range (z < 0.4), given that they effectively captures the bulk of the studied populations, as noted in Sect. 2.2. If the investigated sources undergo strong cosmological evolution, these distributions may appear substantially distinct, however such evolution is not expected, as was reported in Smolčić et al. (2009) and Padovani et al. (2015).
3.3. Understanding the observed scaling relations
The total power of a jet extracted via the Blandford–Znajek (BZ) mechanism (Blandford & Znajek 1977), Pj, can be expressed as a function of the dimensionless magnetic flux parameter 0 < φ ≤ 1 (i.e. the magnetic flux threading the black-hole horizon, normalized to its maximum value corresponding to the ‘magnetically arrested disc’ regime), the dimensionless black-hole spin 0 < a ≤ 1, and the mass accretion rate Ṁacc (Tchekhovskoy et al. 2011):
 (1)
(1)
where F(a) is a function of the black-hole spin. In Appendix A we provide a simple derivation of this formula, along with the explicit form of the function F(a).
Only a small fraction of this total jet power is radiated away at radio frequencies. In the literature, various scaling relations between Pj and the observed radio luminosity Lr have been discussed (Willott et al. 1999; Cavagnolo et al. 2010; O’Sullivan et al. 2011; Godfrey & Shabala 2016), typically consistent with a simple parametrization
 (2)
(2)
which we adopt in the discussion below.
Moreover, the mass accretion rate can be expressed in terms of the Eddington parameter λ. From general considerations of accretion disc theory (Narayan et al. 1998), it follows that (see Appendix B)
 (3)
(3)
where ṁ is the mass accretion rate normalized to Eddington units, ṁ ≡ Ṁacc/ṀEdd with ṀEdd ∝ MBH, and ṁcr is the critical dimensionless value separating the regime of radiatively inefficient accretion flows from standard Shakura–Sunyaev discs.
With the above considerations, the expected scaling between the radio (jet related) and bolometric (accretion related) luminosity becomes
![Mathematical equation: $$ \begin{aligned} L_r\propto {\left\{ \begin{array}{ll} \quad [\varphi ^2 F\!(a)]^{1/\alpha }\,L_\mathrm{bol} ^{1/2\alpha }\,M_\mathrm{BH} ^{1/2\alpha }&\quad \text{ for} \quad \lambda < \dot{m}_{cr}, \\ \quad [\varphi ^2F\!(a)]^{1/\alpha }\,L_\mathrm{bol} ^{1/\alpha }&\quad \text{ for} \quad \lambda \ge \dot{m}_{cr}. \end{array}\right.} \end{aligned} $$](/articles/aa/full_html/2026/04/aa57370-25/aa57370-25-eq9.gif) (4)
(4)
The radio-loudness parameter, ℛ = Lr/Lbol, on the other hand, becomes
![Mathematical equation: $$ \begin{aligned} \mathcal{R} \propto {\left\{ \begin{array}{ll} \quad [\varphi ^2 F\!(a)]^{1/\alpha }\, \lambda ^{(0.5-\alpha )/\alpha }\,M_\mathrm{BH} ^{(1-\alpha )/\alpha }&\quad \text{ for} \quad \lambda < \dot{m}_{cr}, \\ \quad [\varphi ^2 F\!(a)]^{1/\alpha }\, \lambda ^{(1-\alpha )/\alpha }\,M_\mathrm{BH} ^{(1-\alpha )/\alpha }&\quad \text{ for} \quad \lambda \ge \dot{m}_{cr}. \end{array}\right.} \end{aligned} $$](/articles/aa/full_html/2026/04/aa57370-25/aa57370-25-eq10.gif) (5)
(5)
In Fig. 7 we show the radio luminosity as the function of BH mass (panel a) and bolometric luminosity (panel b), and radio loudness versus Eddington ratio (panel c). The functional form by which the radio loudness depends on these parameters was given by Eqs. (4) and (5). In Fig. 7 we attempt to constrain the α parameter by showing the lines corresponding to the scaling with α = 0.5 and α = 1.0.
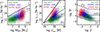 |
Fig. 7. (a) SF-corrected radio luminosity versus black-hole mass (as in Fig. 6a). Overplotted lines show L1.4 ∝ MBH (dashed) and |


The expected trends are indeed present in Figs. 7a and 7b, with the scatter corresponding to the variation in [φ2 F(a)] 1/α. However, a more robust interpretation is hampered by the fact that our subsamples, Seyferts, OPARGs, and OPIRGs, differ in their distributions of λ and MBH. As a result, a simple comparison of the observed luminosity–luminosity trends with the expected Lr–Lbol scaling alone should be considered with caution, especially as a positive luminosity–luminosity correlation in a sample of cosmologically distant sources may not be intrinsic to the population but instead induced by flux limits.
In Fig. 7c we plot the radio-loudness versus Eddington ratio for our sample. An overall anti-correlation trend is apparent, which in fact is characteristic for the general AGN population (also present in Sikora et al. 2007), and this favours a α > 0.5 scaling (unless MBH is substantially anti-correlated with λ). Indeed, a closer look at this figure favours α ≈ 1, which is in good agreement with the α ≈ 0.9 obtained by Willott et al. (1999), the dashed lines marking the relation expected for α = 1 and ṁcr = 10−2, with three arbitrary normalizations differing successively by a factor of 100. We note that the distribution of radio loudness does not explicitly depend on black-hole mass, given that both model parameters, the dimensionless magnetic flux φ, and BH spin a are independent on MBH. This shows that, at fixed λ, the full observed spread in ℛ can be explained solely by variations in [φ2F(a)].
The implication of those relations is that, while at a higher Eddington ratio (λ ≥ ṁcr) the radio luminosity is a linear function of the bolometric luminosity, the radio loudness parameter is expected to be flat, with the scatter resulting from the variation of the [φ2 F(a)] term. At a lower Eddington ratio (λ < ṁcr), this dependence becomes more complex, with radio luminosity varying as  and radio loudness being a simpler function of Eddington ratio varying as
  , with the scatter again resulting from the [φ2 F(a)] term.
We now consider the expected scatter from this relation, and whether it can account for the variations observed in our sample. Unlike the magnetic flux, the spin of a black hole can be constrained through astrophysical observations. However, this is only possible for a small number of objects, and the results are subject to observational biases and strong dependence on the method used. Current spin estimates for a limited sample tend to favour high spin values (Soares & Nemmen 2020; Reynolds 2021), which are consistent with a unimodal spin distribution.
To infer spin information for a much larger population of black holes, we must turn to cosmological simulations. In HORIZON-AGN (Dubois et al. 2014), initially non-spinning (Schwarzschild) black holes evolve through gas accretion and mergers, which produce, by the present epoch, a continuous spin distribution spanning a ∼ 0.6–1.0 (Beckmann et al. 2024). More recently, the NEWHORIZON simulation (Dubois et al. 2021) investigated intermediate-mass and massive black holes, explicitly including spin-down from BZ feedback. Despite the simulation’s limited volume, this feedback only slightly reduces spins, leaving massive black holes mostly unaffected and preserving a continuous overall distribution (Beckmann et al. 2025).
Taking into account both observational constraints and numerical simulations, we conclude that spins in the range a ∼ 0.6–1.0 are likely to be typical for the massive black holes considered in this work. However, variations within this interval can explain at most a factor of ∼7 in the observed radio luminosities and radio loudness. The additional spread is more plausibly attributed to differences in the magnetic flux.
To estimate the required variation in the dimensionless magnetic flux (φ), we note that a change in φ by a factor of ∼4 across a given galaxy population, combined with independent scatter in black-hole spins within the range 0.6 < a < 1.0, would cause the term [φ2, F(a)] to vary by about ∼2 dex. This level of variation can account for the trends observed in the radio Seyfert sample as well as in the bulk of the OPARG and compact-radio subsamples. However, the OPARG/extended-radio and OPIRG sources are considerably more radio loud, spanning over 4 dex in radio loudness at a fixed λ. Explaining this spread within our scaling relations would therefore require a much larger variation in φ across these populations.
We further note that extended radio sources in the OPARG and OPIRG categories are preferentially located on the upper branch of the radio-loudness versus Eddington ratio diagram (see Fig. 5). This suggests that long jet duty cycles characteristic of these systems are necessary for galaxies to reach the most extreme radio-loudness parameter values.
4. Conclusions
We analysed the radio-loudness distribution of a large, homogeneous sample of radio galaxies from the local Universe (z < 0.4) that were selected from the SDSS MGS and present in the ROGUE I and II catalogues. All sources, regardless of their radio extent or luminosity, were included. By considering both compact and extended systems and accounting for the contribution of star formation to the radio emission, we inferred the relation between radio loudness, accretion rate, and host galaxy properties. Our subsamples of radio Seyferts, OPIRGs, and OPARGs were primarily defined by their positions in the Dn(4000) versus L1.4/M★ plane, their Hα equivalent widths, and their positions in the BPT diagram. Our conclusions are as follows.
-
Since our sample includes compact radio sources, which constitute the majority of radio galaxies, the distribution of radio loudness appears smooth and definitely not bi-modal, as found in some previous studies.
-
The highest ℛ values are almost exclusively reached by radio galaxies with extended radio structures, such as FRI, FRII, FRI/II, and others.
-
The radio-loudness parameter ℛ is anti-correlated with the Eddington ratio λ.
-
We find a large spread in the radio-loudness parameter ℛ values of two to three orders of magnitude at any given accretion rate. The ℛ scatter increases with decreasing λ, especially at the high-ℛ tail of the distribution for both OPIRGs and OPARGs.
-
Spirals and lenticulars occupy the high-λ, low-ℛ region, while ellipticals lie at lower λ and higher ℛ and exhibit a larger scatter.
-
Radio Seyferts, OPARGs, and OPIRGs form a sequence of increasing MBH with a large overlap among subsamples. Radio Seyferts show no correlation between radio loudness with MBH, while OPARGs and OPIRGs show a weak trend between MBH and ℛ.
-
By applying theoretical models, we derived scaling relations that relate radio luminosity and radio loudness to bolometric (accretion-related) luminosity and black-hole mass.
-
Within the framework of the derived scaling relations, the observed spread of up to two orders of magnitude in both radio luminosity and radio loudness can be attributed to variations in the dimensionless magnetic flux φ by only a factor of ∼4, under the assumption that black-hole spins are in the range a = 0.6–1.0.
Acknowledgments
This work was done within the framework of the research project no. 2021/43/B/ST9/03246 financed by the National Science Centre/Narodowe Centrum Nauki. AW was supported by the GACR grant 21-13491X. NVA acknowledges support of Conselho Nacional de Desenvolvimento Científico e Tecnológico (CNPq). Funding for the creation and distribution of the SDSS Archive has been provided by the Alfred P. Sloan Foundation, the Participating Institutions, the National Aeronautics and Space Administration, the National Science Foundation, the U.S. Department of Energy, the Japanese Monbukagakusho, and the Max Planck Society. The SDSS Web site is http://www.sdss.org/. The Participating Institutions are The University of Chicago, Fermilab, the Institute for Advanced Study, the Japan Participation Group, The Johns Hopkins University, the Max-Planck-Institute for Astronomy (MPIA), the Max-Planck-Institute for Astrophysics (MPA), New Mexico State University, Princeton University, the United States Naval Observatory, and the University of Washington. This research made use of Astropy (http://www.astropy.org), a community-developed core Python package for Astronomy (Astropy Collaboration 2013, 2018).
References
- Abazajian, K. N., Adelman-McCarthy, J. K., Agüeros, M. A., et al. 2009, ApJS, 182, 543 [Google Scholar]
- Asari, N. V., Cid Fernandes, R., Stasińska, G., et al. 2007, MNRAS, 381, 263 [Google Scholar]
- Astropy Collaboration (Robitaille, T. P., et al.) 2013, A&A, 558, A33 [NASA ADS] [CrossRef] [EDP Sciences] [Google Scholar]
- Astropy Collaboration (Price-Whelan, A. M., et al.) 2018, AJ, 156, 123 [Google Scholar]
- Baldwin, J. A., Phillips, M. M., & Terlevich, R. 1981, PASP, 93, 5 [Google Scholar]
- Beckmann, R. S., Smethurst, R. J., Simmons, B. D., et al. 2024, MNRAS, 527, 10867 [Google Scholar]
- Beckmann, R. S., Dubois, Y., Volonteri, M., et al. 2025, MNRAS, 536, 1838 [Google Scholar]
- Bicknell, G. V. 2002, New Astron. Rev., 46, 365 [CrossRef] [Google Scholar]
- Blandford, R. D., & Znajek, R. L. 1977, MNRAS, 179, 433 [NASA ADS] [CrossRef] [Google Scholar]
- Capetti, A., Brienza, M., Balmaverde, B., et al. 2022, A&A, 660, A93 [NASA ADS] [CrossRef] [EDP Sciences] [Google Scholar]
- Cavagnolo, K. W., McNamara, B. R., Nulsen, P. E. J., et al. 2010, ApJ, 720, 1066 [Google Scholar]
- Cid Fernandes, R., Mateus, A., Sodré, L., Stasińska, G., & Gomes, J. M. 2005, MNRAS, 358, 363 [Google Scholar]
- Cid Fernandes, R., Stasińska, G., Mateus, A., & Vale Asari, N. 2011, MNRAS, 413, 1687 [Google Scholar]
- Condon, J. J., Cotton, W. D., Greisen, E. W., et al. 1998, AJ, 115, 1693 [Google Scholar]
- Dubois, Y., Volonteri, M., & Silk, J. 2014, MNRAS, 440, 1590 [Google Scholar]
- Dubois, Y., Beckmann, R., Bournaud, F., et al. 2021, A&A, 651, A109 [NASA ADS] [CrossRef] [EDP Sciences] [Google Scholar]
- Ekholm, T., Baryshev, Y., Teerikorpi, P., Hanski, M. O., & Paturel, G. 2001, A&A, 368, L17 [NASA ADS] [CrossRef] [EDP Sciences] [Google Scholar]
- Ermash, A. A. 2013, Astron. Rep., 57, 317 [NASA ADS] [CrossRef] [Google Scholar]
- Godfrey, L. E. H., & Shabala, S. S. 2016, MNRAS, 456, 1172 [NASA ADS] [CrossRef] [Google Scholar]
- Gupta, M., Sikora, M., Rusinek, K., & Madejski, G. M. 2018, MNRAS, 480, 2861 [NASA ADS] [CrossRef] [Google Scholar]
- Hardcastle, M. J., & Croston, J. H. 2020, New Astron. Rev., 88, 101539 [Google Scholar]
- Ho, L. C., & Peng, C. Y. 2001, ApJ, 555, 650 [Google Scholar]
- Igumenshchev, I. V., Narayan, R., & Abramowicz, M. A. 2003, ApJ, 592, 1042 [Google Scholar]
- Im, M., Griffiths, R. E., Ratnatunga, K. U., & Sarajedini, V. L. 1996, ApJ, 461, L79 [Google Scholar]
- Ivezić, Ž., Menou, K., Knapp, G. R., et al. 2002, AJ, 124, 2364 [CrossRef] [Google Scholar]
- Jin, C., Ward, M., & Done, C. 2012, MNRAS, 425, 907 [NASA ADS] [CrossRef] [Google Scholar]
- Jin, J.-J., Zhu, Y.-N., Meng, X.-M., Lei, F.-J., & Wu, H. 2018, ApJ, 864, 32 [NASA ADS] [CrossRef] [Google Scholar]
- Kellermann, K. I., Sramek, R., Schmidt, M., Shaffer, D. B., & Green, R. 1989, AJ, 98, 1195 [Google Scholar]
- Kellermann, K. I., Condon, J. J., Kimball, A. E., Perley, R. A., & Ivezić, Ž. 2016, ApJ, 831, 168 [Google Scholar]
- Kozieł-Wierzbowska, D., Vale Asari, N., Stasińska, G., et al. 2017, ApJ, 846, 42 [CrossRef] [Google Scholar]
- Kozieł-Wierzbowska, D., Goyal, A., & Żywucka, N. 2020, ApJS, 247, 53 [CrossRef] [Google Scholar]
- Kozieł-Wierzbowska, D., Vale Asari, N., Stasińska, G., et al. 2021, ApJ, 910, 64 [CrossRef] [Google Scholar]
- Macfarlane, C., Best, P. N., Sabater, J., et al. 2021, MNRAS, 506, 5888 [NASA ADS] [CrossRef] [Google Scholar]
- Mahony, E. K., Sadler, E. M., Croom, S. M., et al. 2012, ApJ, 754, 12 [Google Scholar]
- Miller, L., Peacock, J. A., & Mead, A. R. G. 1990, MNRAS, 244, 207 [NASA ADS] [Google Scholar]
- Murphy, E. J., Condon, J. J., Schinnerer, E., et al. 2011, ApJ, 737, 67 [Google Scholar]
- Narayan, R., Mahadevan, R., & Quataert, E. 1998, in Theory of Black Hole Accretion Disks, eds. M. A. Abramowicz, G. Björnsson, & J. E. Pringle, 148 [Google Scholar]
- O’Sullivan, E., Giacintucci, S., David, L. P., et al. 2011, ApJ, 735, 11 [Google Scholar]
- Padovani, P., Bonzini, M., Kellermann, K. I., et al. 2015, MNRAS, 452, 1263 [Google Scholar]
- Rafter, S. E., Crenshaw, D. M., & Wiita, P. J. 2009, AJ, 137, 42 [Google Scholar]
- Rankine, A. L., Matthews, J. H., Hewett, P. C., et al. 2021, MNRAS, 502, 4154 [CrossRef] [Google Scholar]
- Reynolds, C. S. 2021, ARA&A, 59, 117 [NASA ADS] [CrossRef] [Google Scholar]
- Rusinek, K., Sikora, M., Kozieł-Wierzbowska, D., & Gupta, M. 2020, ApJ, 900, 125 [NASA ADS] [CrossRef] [Google Scholar]
- Saikia, D. J. 2022, JApA, 43, 97 [NASA ADS] [Google Scholar]
- Sharma, P., Quataert, E., Hammett, G. W., & Stone, J. M. 2007, ApJ, 667, 714 [NASA ADS] [CrossRef] [Google Scholar]
- Sikora, M., Stawarz, Ł., & Lasota, J.-P. 2007, ApJ, 658, 815 [NASA ADS] [CrossRef] [Google Scholar]
- Singal, J., Petrosian, V., Stawarz, Ł., & Lawrence, A. 2013, ApJ, 764, 43 [NASA ADS] [CrossRef] [Google Scholar]
- Singh, V., & Chand, H. 2018, MNRAS, 480, 1796 [NASA ADS] [CrossRef] [Google Scholar]
- Smolčić, V., Zamorani, G., Schinnerer, E., et al. 2009, ApJ, 696, 24 [CrossRef] [Google Scholar]
- Soares, G., & Nemmen, R. 2020, MNRAS, 495, 981 [NASA ADS] [CrossRef] [Google Scholar]
- Spinoglio, L., Fernández-Ontiveros, J. A., & Malkan, M. A. 2024, ApJ, 964, 117 [NASA ADS] [CrossRef] [Google Scholar]
- Stasińska, G., Cid Fernandes, R., Mateus, A., Sodré, L., & Asari, N. V. 2006, MNRAS, 371, 972 [Google Scholar]
- Stasińska, G., Vale Asari, N., Cid Fernandes, R., et al. 2008, MNRAS, 391, L29 [NASA ADS] [Google Scholar]
- Stasińska, G., Vale Asari, N., Wójtowicz, A., & Kozieł-Wierzbowska, D. 2025, A&A, 693, A135 [NASA ADS] [CrossRef] [EDP Sciences] [Google Scholar]
- Strauss, M. A., Weinberg, D. H., Lupton, R. H., et al. 2002, AJ, 124, 1810 [Google Scholar]
- Tadhunter, C. 2016, A&ARv, 24, 10 [Google Scholar]
- Tchekhovskoy, A., Narayan, R., & McKinney, J. C. 2011, MNRAS, 418, L79 [NASA ADS] [CrossRef] [Google Scholar]
- Tremaine, S., Gebhardt, K., Bender, R., et al. 2002, ApJ, 574, 740 [NASA ADS] [CrossRef] [Google Scholar]
- White, R. L., Becker, R. H., Helfand, D. J., & Gregg, M. D. 1997, ApJ, 475, 479 [Google Scholar]
- White, R. L., Becker, R. H., Gregg, M. D., et al. 2000, ApJS, 126, 133 [NASA ADS] [CrossRef] [Google Scholar]
- White, R. L., Helfand, D. J., Becker, R. H., Glikman, E., & de Vries, W. 2007, ApJ, 654, 99 [Google Scholar]
- Wild, V., Asari, N. V., Rowlands, K., et al. 2025, Open J. Astrophys., 8, 3 [Google Scholar]
- Willott, C. J., Rawlings, S., Blundell, K. M., & Lacy, M. 1999, MNRAS, 309, 1017 [Google Scholar]
- Wójtowicz, A., Stawarz, Ł., Cheung, C. C., Werner, N., & Rudka, D. 2023, ApJ, 944, 195 [CrossRef] [Google Scholar]
- Wright, E. L., Eisenhardt, P. R. M., Mainzer, A. K., et al. 2010, AJ, 140, 1868 [Google Scholar]
- Xie, F.-G., & Yuan, F. 2012, MNRAS, 427, 1580 [NASA ADS] [CrossRef] [Google Scholar]
- Xie, F.-G., & Zdziarski, A. A. 2019, ApJ, 887, 167 [NASA ADS] [CrossRef] [Google Scholar]
- Xie, F.-G., Narayan, R., & Yuan, F. 2023, ApJ, 942, 20 [Google Scholar]
- Xu, C., Livio, M., & Baum, S. 1999, AJ, 118, 1169 [Google Scholar]
- York, D. G., Adelman, J., Anderson, J. E., Jr., et al. 2000, AJ, 120, 1579 [NASA ADS] [CrossRef] [Google Scholar]
- Zheng, X. C., Röttgering, H. J. A., Best, P. N., et al. 2020, A&A, 644, A12 [NASA ADS] [CrossRef] [EDP Sciences] [Google Scholar]
Note that the MGS does not contain type I AGNs, which are in the quasar sample of the SDSS.
Throughout this work, all emission lines are given in restframe air wavelengths.
Appendix A: Blandford-Znajek jet power
The total power of a Blandford-Znajek (BZ) jet, as formulated in Tchekhovskoy et al. (2011), is
 (A.1)
(A.1)
where κ ≃ 0.05 is a numerical constant, the angular frequency of the BH horizon is Ω = a c/2 RH, the dimensionless BH spin parameter is a ∈ [0, 1], the BH event horizon radius is  , the gravitational radius of the BH with mass MBH is Rg = GMBH/c2, the magnetic flux threading the BH horizon is denoted by ΦBH, and finally the function
  .
.
The saturation value of the magnetic flux corresponding to the ‘magnetically arrested disc’ (MAD) regime (Igumenshchev et al. 2003) is
 (A.2)
(A.2)
where the numerical constant η ≃ 50 and Ṁacc is the mass accretion rate, one may define the dimensionless magnetic flux parameter
 (A.3)
(A.3)
From these definitions, one may re-write the BZ total jet power as
 (A.4)
(A.4)
where
 (A.5)
(A.5)
As shown in Fig. A.1, for moderate spin values, F(a = 0.5)≃0.2, increasing approximately as a2 by one order of magnitude up to F(a = 1)≃2.
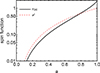 |
Fig. A.1. Spin dependence of the Blandford-Znajek jet. |
Appendix B: Accretion radiative efficiency
The radiative efficiency of accretion discs and flows is defined as
 (B.1)
(B.1)
where Ṁacc is the mass accretion rate and Lbol is the bolometric accretion disc luminosity. The consensus is that, while at high accretion rates the disc radiative efficiency remains approximately constant at a value ϵ0 of a few to a few tens of percent (depending only weakly on the black hole spin), at lower accretion rates, i.e. within the regime of ‘radiatively inefficient accretion flows’, the efficiency decreases approximately linearly with the Eddington-normalized mass accretion rate (see, e.g., Narayan et al. 1998; Sharma et al. 2007; Xie & Yuan 2012; Xie & Zdziarski 2019; Xie et al. 2023). We can therefore parametrize
 (B.2)
(B.2)
where
 (B.3)
(B.3)
What remains most uncertain in this context is the exact value of the critical accretion rate ṁcr. In particular, while canonical general considerations suggest ṁcr ∼ 10−2 (Narayan et al. 1998), some numerical simulations (Sharma et al. 2007), as well as the most recent calculations carried out in the MAD limit for the nearby supermassive black holes M87 and Sgr A* (Xie et al. 2023), suggest that accretion discs may remain relatively efficient at the few-percent level down to much lower critical mass accretion rates than previously thought.
Note that, with the above scaling of the disc radiative efficiency ϵ, the accretion Eddington parameter is then expected to scale as
 (B.4)
(B.4)
All Figures
|
Fig. 1. Flowchart detailing our sample selection. Retired galaxies are galaxies that have stopped forming stars and are ionized by their populations of HOLMES (see: Stasińska et al. 2008). Similarly to the star-forming galaxies, they are not relevant for the present study. The parent ‘ROGUE I & II SDSS MGS’ sample already incorporates redshift range limits, optical spectral quality cuts, and removal of sources whose radio morphology is blended or non-detected. The number of sources in each subsample is given in the panels. Numbers in brackets show number counts before applying limits to the S/N of [O III] or W3 luminosities, to emission line detection, and to the star-formation-corrected radio luminosity values. |
| In the text | |
|
Fig. 2. Diagrams showing the loci of our radio Seyfert (green), OPARG (blue), and OPIRG (red) subsamples in relation to our parent samples: ROGUE I & II SDSS MGS (‘ROGUE-MGS’) for panel (a), SDSS MGS (‘MGS’) for panels (b) and (c) (grey points). (a) Dn(4000) versus L1.4/M★ (DLM) plane. The dashed line by Kozieł-Wierzbowska et al. (2021) separates radio emission dominated (top) or not (bottom) by AGN. (b) [O III]λ5007/Hβ versus [N II]λ6584/Hα (BPT) plane. The dashed line by Stasińska et al. (2006) separates galaxies ionized by star formation alone (left) from those ionized by a hard ionizing radiation field (right). OPIRGs are not shown since they have not been selected based on this diagram. (c) W(Hα) versus [N II]λ6584/Hα (WHAN) plane. The dashed line shows the W(Hα) = 3 Å criterion by Cid Fernandes et al. (2011) to separate ionization by HOLMES (bottom) from ionization by other sources (top). OPIRGs that lack [N II] detection are not shown on this plane. |
| In the text | |
|
Fig. 3. Total radio luminosity (a)–(d), absolute magnitude in the r band (e)–(h), and mid-infrared W3 luminosity (i)–(l) as a function of redshift. Colours indicate the samples: radio Seyferts are in green, OPARGs in blue, and OPIRGs in red. The grey points indicate the parent samples: ROGUE I & II SDSS MGS (‘ROGUE-MGS’) for the first row, SDSS MGS (‘MGS’) for the second and third rows. Numbers on the panel show the count of objects. Subsamples are shown overplotted on the parent sample on the first three columns; parent samples plus all subsamples are show together on the last column for comparison. |
| In the text | |
|
Fig. 4. Two-dimensional histograms of radio loudness (ℛ) versus Eddington ratio (λ) for radio Seyfert and OPARG objects (a) and radio Seyfert, OPARG, and OPIRG objects combined (b). Bin colours represent the logarithm of the number of objects, as indicated by the colour bars. Marginal 1D histograms of radio loudness are shown on the right-hand side of each panel. Values with and without a prime indicate Lbol derived solely from [O III] or from a mix of [O III] (for OPARG and Seyfert) and W3 (for OPIRG) luminosities, respectively. The number of objects is indicated in each panel. The dashed line corresponds to the classical radio-loudness threshold of Kellermann et al. (1989), and the dotted line to the division from Gupta et al. (2018); both are shown using our convention. No bimodality is seen in either the 1D or 2D histograms. |
| In the text | |
|
Fig. 5. Scatter plots of radio loudness (ℛ) versus Eddington ratio (λ) for different subsamples: radio Seyfert and OPARG (a); radio Seyfert and extended sources (b); radio Seyfert, OPARG, and OPIRG (c); and by optical morphology: spiral, lenticular, and elliptical (d). Extended sources are those classified with radio morphologies FRI, FRII, FRI/II, OI, OII, Z, X, DD, WAT, NAT, or HT in the ROGUE catalogues. Subsample sizes are indicated in each panel. Marginal 1D histograms of radio loudness for each subsample are shown on the right-hand side of each panel. Reference lines and primed and unprimed quantities are as in Fig. 4. |
| In the text | |
|
Fig. 6. (a) SF-corrected radio luminosity. (b) Radio loudness. (c) Bolometric luminosity versus black-hole mass. (d) Radio luminosity as a function of bolometric luminosity. (e) Radio size (measured from FIRST) as a function of black-hole mass. All panels show radio Seyferts, OPARGs, and OPIRGs (sample sizes in legends). |
| In the text | |
|
Fig. 7. (a) SF-corrected radio luminosity versus black-hole mass (as in Fig. 6a). Overplotted lines show L1.4 ∝ MBH (dashed) and |
| In the text | |
|
Fig. A.1. Spin dependence of the Blandford-Znajek jet. |
| In the text | |
Current usage metrics show cumulative count of Article Views (full-text article views including HTML views, PDF and ePub downloads, according to the available data) and Abstracts Views on Vision4Press platform.
Data correspond to usage on the plateform after 2015. The current usage metrics is available 48-96 hours after online publication and is updated daily on week days.
Initial download of the metrics may take a while.