Fig. 4.
Download original image
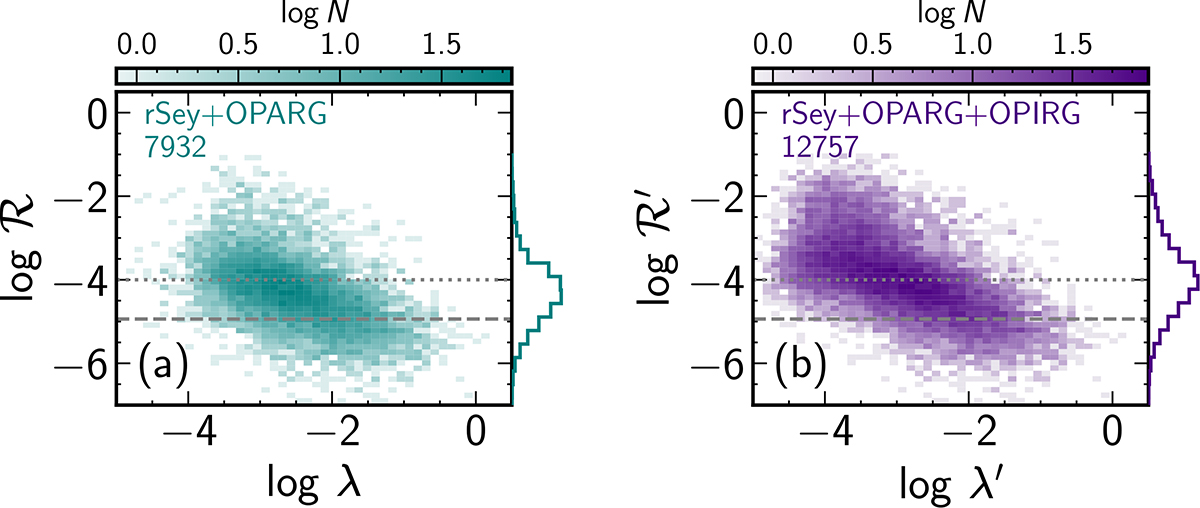
Two-dimensional histograms of radio loudness (ℛ) versus Eddington ratio (λ) for radio Seyfert and OPARG objects (a) and radio Seyfert, OPARG, and OPIRG objects combined (b). Bin colours represent the logarithm of the number of objects, as indicated by the colour bars. Marginal 1D histograms of radio loudness are shown on the right-hand side of each panel. Values with and without a prime indicate Lbol derived solely from [O III] or from a mix of [O III] (for OPARG and Seyfert) and W3 (for OPIRG) luminosities, respectively. The number of objects is indicated in each panel. The dashed line corresponds to the classical radio-loudness threshold of Kellermann et al. (1989), and the dotted line to the division from Gupta et al. (2018); both are shown using our convention. No bimodality is seen in either the 1D or 2D histograms.
Current usage metrics show cumulative count of Article Views (full-text article views including HTML views, PDF and ePub downloads, according to the available data) and Abstracts Views on Vision4Press platform.
Data correspond to usage on the plateform after 2015. The current usage metrics is available 48-96 hours after online publication and is updated daily on week days.
Initial download of the metrics may take a while.