Fig. 5.
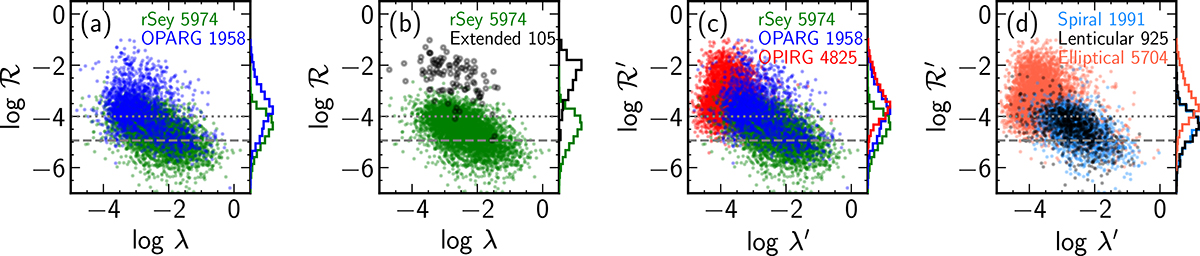
Download original image
Scatter plots of radio loudness (ℛ) versus Eddington ratio (λ) for different subsamples: radio Seyfert and OPARG (a); radio Seyfert and extended sources (b); radio Seyfert, OPARG, and OPIRG (c); and by optical morphology: spiral, lenticular, and elliptical (d). Extended sources are those classified with radio morphologies FRI, FRII, FRI/II, OI, OII, Z, X, DD, WAT, NAT, or HT in the ROGUE catalogues. Subsample sizes are indicated in each panel. Marginal 1D histograms of radio loudness for each subsample are shown on the right-hand side of each panel. Reference lines and primed and unprimed quantities are as in Fig. 4.
Current usage metrics show cumulative count of Article Views (full-text article views including HTML views, PDF and ePub downloads, according to the available data) and Abstracts Views on Vision4Press platform.
Data correspond to usage on the plateform after 2015. The current usage metrics is available 48-96 hours after online publication and is updated daily on week days.
Initial download of the metrics may take a while.