Fig. 1.
Download original image
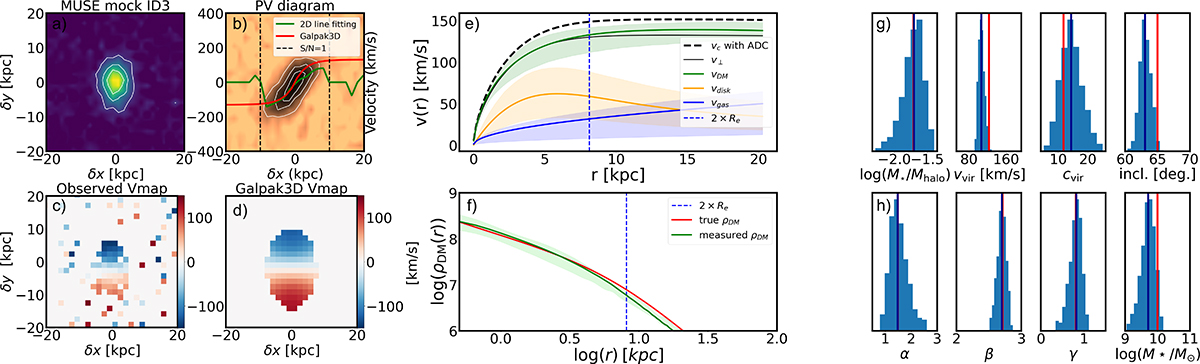
Results from the 3D disk-halo decomposition applied to the mock MUSE cube of the simulated galaxy ID3. Panel (a): Mock MUSE white-light image with flux intensity contours overlaid. Panel (b): Position velocity diagram. The observed velocity profiles as measured with GALPAK3D and MPDAF (Bacon et al. 2016) are overlaid in red and green, respectively. The dotted black line shows the region beyond which the S/N of the emission line falls below unity, whereas the white contours show the flux intensity. Panels (c) and (d): Observed velocity field obtained using a traditional 2D line fitting code and the modelled velocity field obtained from 3D disk-halo decomposition with GALPAK3D. Panel (e): Contribution of the different components (stars-orange, gas-blue, DM-green curve) to the RC (dot-dashed curve; corrected for pressure support). Panel (f): Measured DM density profile (in green) compared to the true DM density profile (in red). The light shaded regions in these two panels show the 95% confidence interval. Panel (g): Posterior distributions (in blue) for a subset of the parameters we fit for: log(X) = log(M★/Mhalo), the virial velocity, the concentration, and the disk inclination. Panel (h): Posterior distributions for parameters derived from the fitted ones, including the DM density profile shape parameters α, β, and γ (computed using Eqs. (A.2), (A.3), and (A.4), respectively), as well as the stellar mass log(M★/M⊙). The recovered values are shown as the dark blue lines, while the values used as inputs for the simulation are shown as the red lines.
Current usage metrics show cumulative count of Article Views (full-text article views including HTML views, PDF and ePub downloads, according to the available data) and Abstracts Views on Vision4Press platform.
Data correspond to usage on the plateform after 2015. The current usage metrics is available 48-96 hours after online publication and is updated daily on week days.
Initial download of the metrics may take a while.