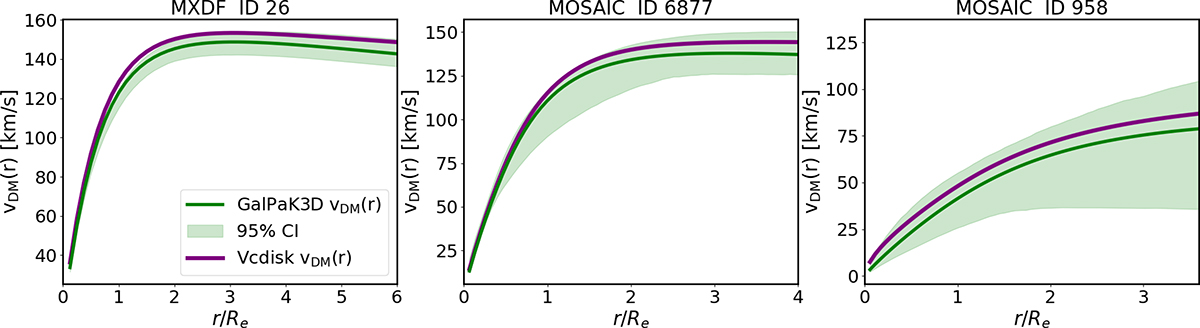
Fig. 10.
Download original image
Comparison of DM velocity profiles for the three galaxies shown in Fig. 9. The green curves show the profiles modelled with GALPAK3D assuming a DC14 halo, while the purple curves are obtained by subtracting the baryonic contributions obtained with vcdisk from the MUSE-derived vc(r). The green shaded regions indicate the 95% confidence intervals from the 3D disk–halo decomposition fits.
Current usage metrics show cumulative count of Article Views (full-text article views including HTML views, PDF and ePub downloads, according to the available data) and Abstracts Views on Vision4Press platform.
Data correspond to usage on the plateform after 2015. The current usage metrics is available 48-96 hours after online publication and is updated daily on week days.
Initial download of the metrics may take a while.