Fig. 11.
Download original image
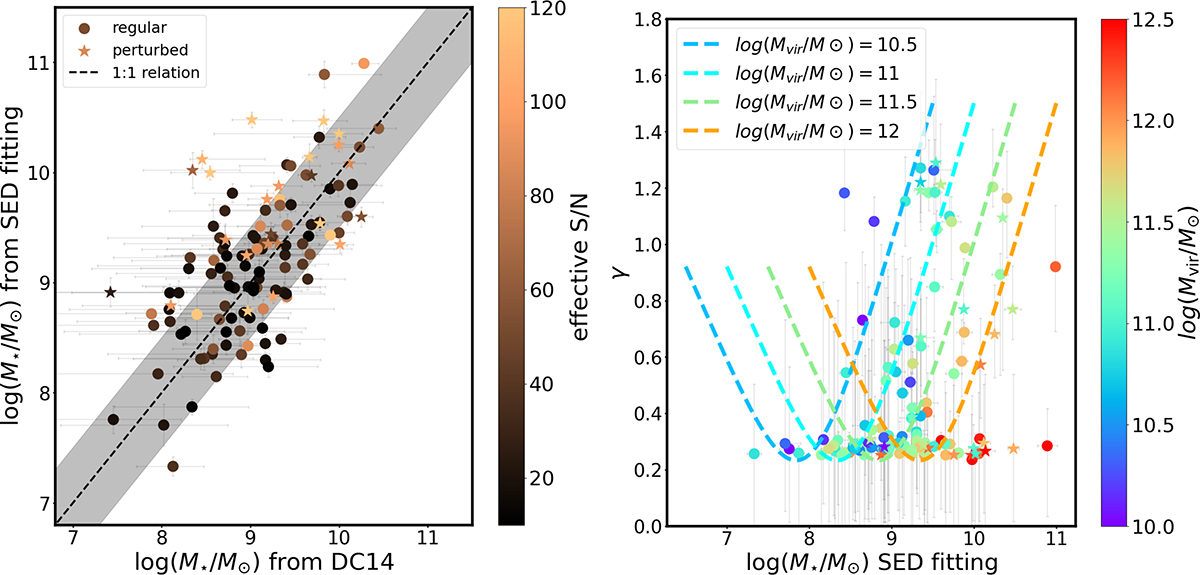
Left: Comparison between the stellar masses inferred from our disk-halo decomposition using the DC14 halo model and the stellar masses inferred from photometric observations. The dashed black line shows the 1:1 relation, and the grey shaded region shows the 0.5 dex dispersion around the relation. The data points are colour-coded according to their S/Neff. Right: DM inner slope, γ, as inferred from the DC14 halo model as a function of the stellar masses derived from SED fitting. The data points are colour-coded according to their virial masses. The coloured curves depict the parametrisation of Di Cintio et al. (2014) for γ (Eq. (A.4)), for four different virial masses, as indicated in the legend. In both panels, the circles show the regular MHUDF galaxies, while the stars depict the perturbed galaxies from our sample. The error bars represent the 95% confidence intervals.
Current usage metrics show cumulative count of Article Views (full-text article views including HTML views, PDF and ePub downloads, according to the available data) and Abstracts Views on Vision4Press platform.
Data correspond to usage on the plateform after 2015. The current usage metrics is available 48-96 hours after online publication and is updated daily on week days.
Initial download of the metrics may take a while.