Fig. 12.
Download original image
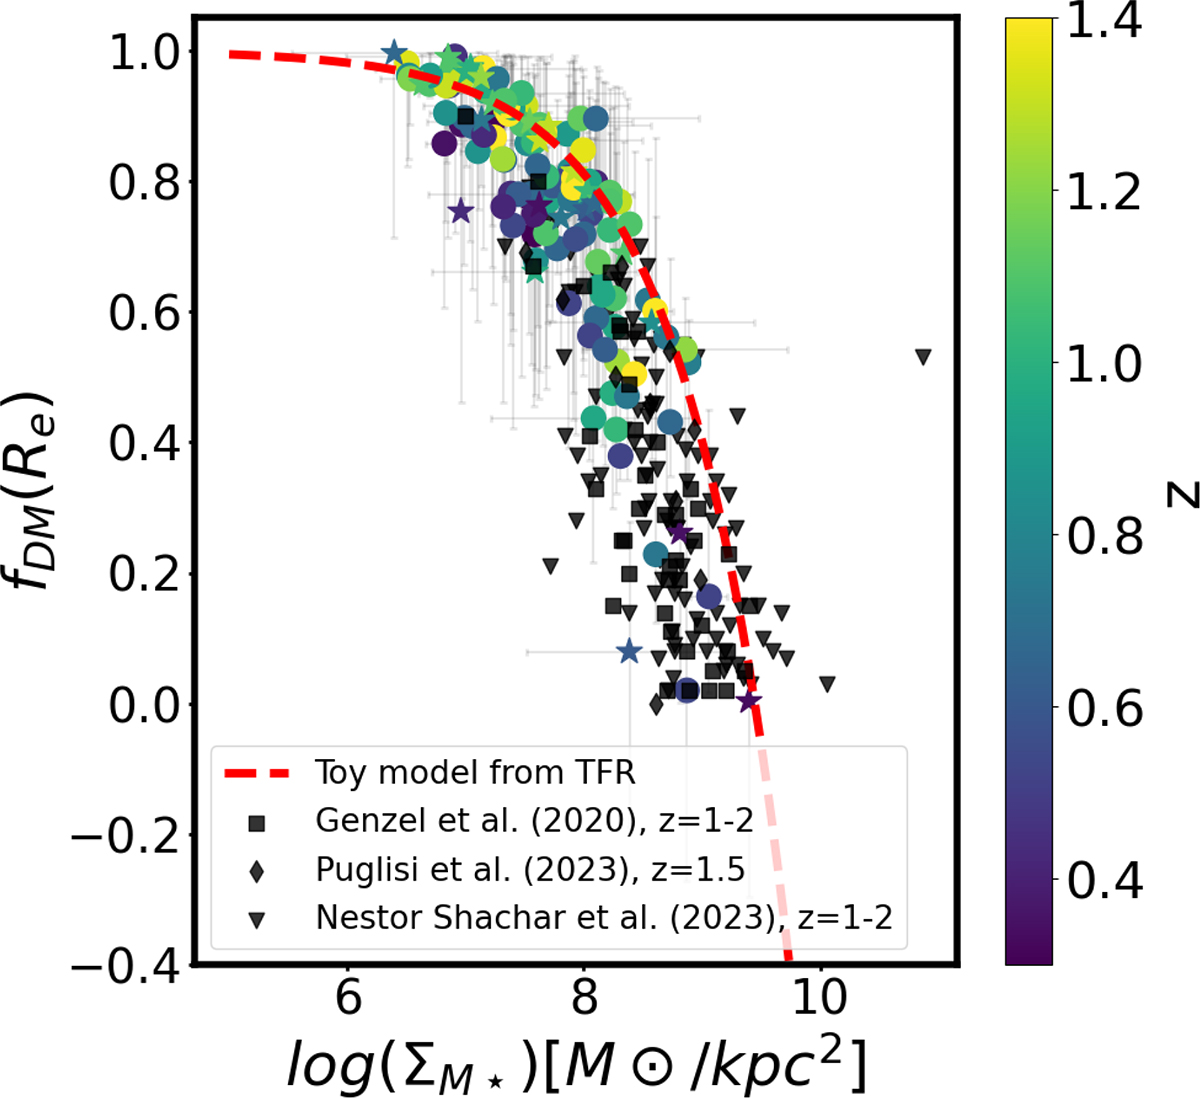
DM fractions within Re as a function of the stellar mass surface density. The black diamonds show the DM fractions inferred by Puglisi et al. (2023) for z ∼ 1.5 SFGs, the black squares depict the z = 1 − 2 sample of Genzel et al. (2020), while the black triangles show the RC100 sample from Nestor Shachar et al. (2023). Our sample is colour-coded according to its redshifts. The circles depict the regular galaxies, while the stars represent the perturbed systems from our sample. The error bars represent the 95% confidence intervals. The red dotted line shows the toy model derived from the Tully–Fisher relation (see Bouché et al. 2022, Sect. 5.1).
Current usage metrics show cumulative count of Article Views (full-text article views including HTML views, PDF and ePub downloads, according to the available data) and Abstracts Views on Vision4Press platform.
Data correspond to usage on the plateform after 2015. The current usage metrics is available 48-96 hours after online publication and is updated daily on week days.
Initial download of the metrics may take a while.