Fig. 14.
Download original image
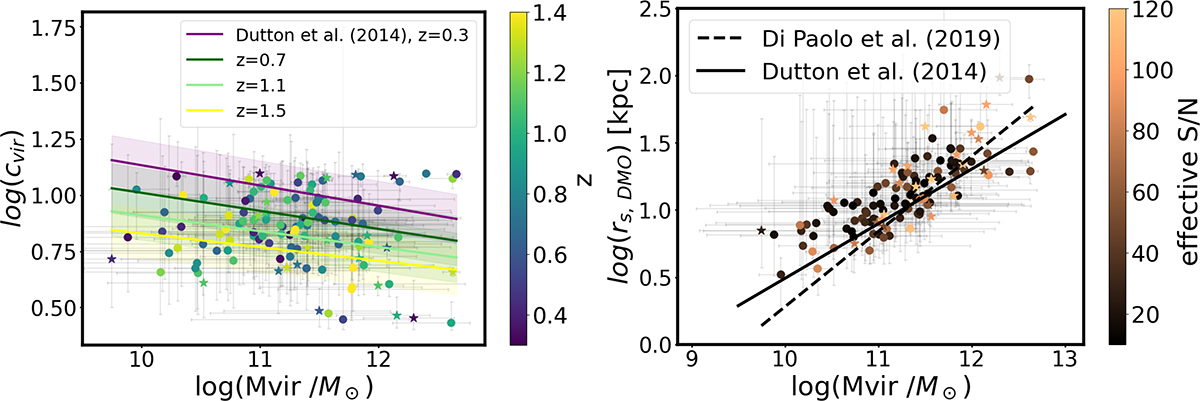
Left: Concentration–halo mass relation for the MHUDF sample. The solid coloured lines show the cvir − Mvir relation from Dutton & Macció (2014) for 0.3 < z < 1.5, while the shaded regions show the 0.11 dex scatter around the relations. The data points are colour-coded according to their redshifts. Right: rs, DMO = rvir/cvir in [kpc] as a function of the halo masses. The dotted black line displays the observed scaling relation for z = 0 low surface brightness systems inferred by Di Paolo et al. (2019), while the solid black line shows the predictions from Dutton & Macció (2014). The data points are colour-coded according to their effective S/N. In both panels, the circles show the regular MHUDF galaxies, while the stars depict the perturbed galaxies. The error bars represent the 95% confidence intervals.
Current usage metrics show cumulative count of Article Views (full-text article views including HTML views, PDF and ePub downloads, according to the available data) and Abstracts Views on Vision4Press platform.
Data correspond to usage on the plateform after 2015. The current usage metrics is available 48-96 hours after online publication and is updated daily on week days.
Initial download of the metrics may take a while.