Fig. 15.
Download original image
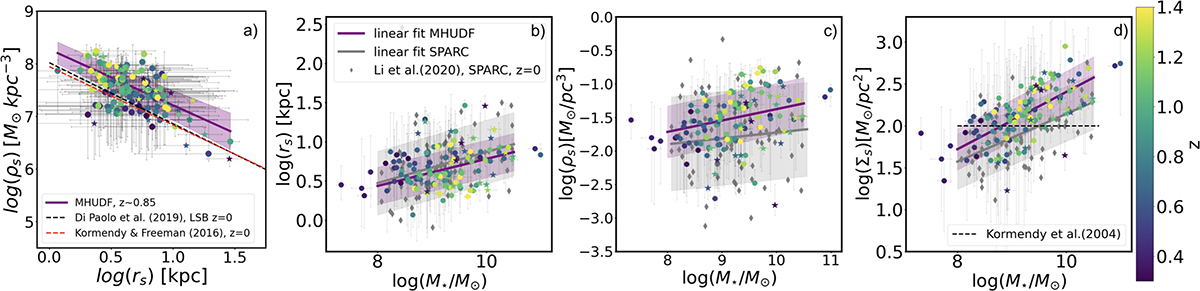
Panel (a): Halo scale radius–DM density relation for the MHUDF sample. The dashed black line shows the relation inferred by Di Paolo et al. (2019) for z = 0 low surface brightness galaxies, while the dashed red line shows the relation derived by Kormendy & Freeman (2016) for z = 0 SFGs. The purple line shows a power-law fit to our mass complete sample, with ![]() , whereas the purple-shaded region shows the dispersion around the relation. Panel (b): Halo scale radius–stellar mass relation. Panel (c): DM density–stellar mass relation. Panel (d): DM surface density (
, whereas the purple-shaded region shows the dispersion around the relation. Panel (b): Halo scale radius–stellar mass relation. Panel (c): DM density–stellar mass relation. Panel (d): DM surface density (![]() )–stellar mass relation. In panels (b), (c), and (d), the grey diamonds represent the mass-matched SPARC sample at z = 0 from Li et al. (2020). The purple and grey lines represent linear fits to the MHUDF and SPARC galaxies, respectively. The shaded regions show the dispersion around the relations. The dashed black line in panel (d) shows the constant DM surface density inferred by Kormendy & Freeman (2016). In all the panels, our sample is colour-coded according to its z. The circles show the regular MHUDF galaxies, while the stars depict the perturbed systems. The error bars represent the 95% confidence intervals.
)–stellar mass relation. In panels (b), (c), and (d), the grey diamonds represent the mass-matched SPARC sample at z = 0 from Li et al. (2020). The purple and grey lines represent linear fits to the MHUDF and SPARC galaxies, respectively. The shaded regions show the dispersion around the relations. The dashed black line in panel (d) shows the constant DM surface density inferred by Kormendy & Freeman (2016). In all the panels, our sample is colour-coded according to its z. The circles show the regular MHUDF galaxies, while the stars depict the perturbed systems. The error bars represent the 95% confidence intervals.
Current usage metrics show cumulative count of Article Views (full-text article views including HTML views, PDF and ePub downloads, according to the available data) and Abstracts Views on Vision4Press platform.
Data correspond to usage on the plateform after 2015. The current usage metrics is available 48-96 hours after online publication and is updated daily on week days.
Initial download of the metrics may take a while.