Fig. 16.
Download original image
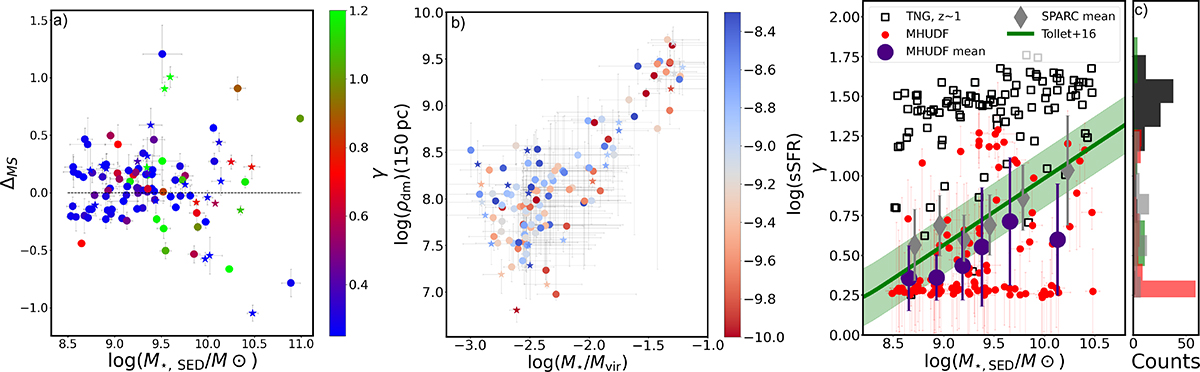
Panel (a): Stellar masses of the entire MHUDF sample (with log(M★/M⊙) > 8.5) as a function of the offset from the SFMS (ΔMS) from Boogaard et al. (2018). The data points are colour-coded according to the DM inner slope, γ. The error bars show the 1σ statistical uncertainties in M★ and SFR from Magphys. Panel (b): DM density at 150 pc as a function of log(M★/Mvir). The data points are colour-coded according to their sSFRs. The error bars represent the 95% confidence intervals from our disk-halo decomposition. In both panels, the circles show the regular MHUDF galaxies, while the stars depict the perturbed systems from our sample. Panel (c): γ as a function of the stellar masses for the mass-matched MHUDF sample (red circles) and the TNG galaxies (black open squares, from Pillepich et al. 2019). The large indigo data points show the mean values for γ of the MHUDF sample in 6 mass bins, while the grey diamonds show the mean values for the mass-matched SPARC sample at z = 0 (using the DC14 fits without ΛCDM priors from Li et al. 2020). The green curve shows the predictions from Tollet et al. (2016) at z = 0, whereas the green shaded region shows the 0.18 dex scatter around the relation. The histogram shows the distribution of the γ values for the mass-matched MHUDF (in red), SPARC (in grey), TNG (in black), and NIHAO (in green) samples.
Current usage metrics show cumulative count of Article Views (full-text article views including HTML views, PDF and ePub downloads, according to the available data) and Abstracts Views on Vision4Press platform.
Data correspond to usage on the plateform after 2015. The current usage metrics is available 48-96 hours after online publication and is updated daily on week days.
Initial download of the metrics may take a while.