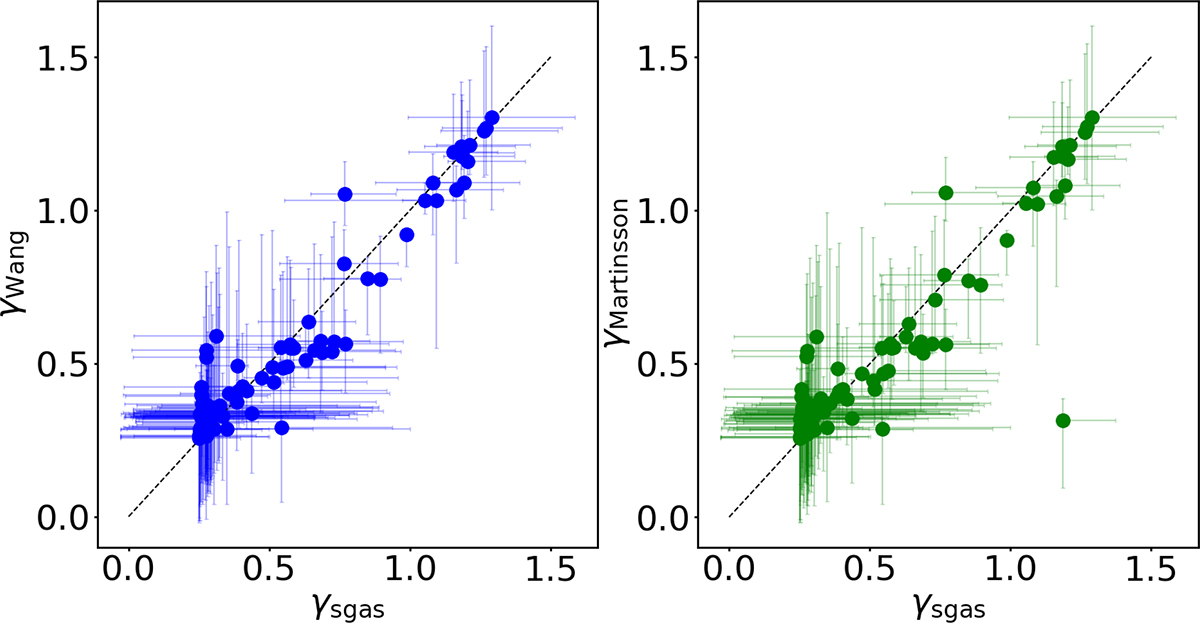
Fig. B.1.
Download original image
Comparison of the inner DM slope γ obtained using different HI surface density models in the disk-halo decomposition. Shown are the constant HI surface mass density vs the Martinsson et al. (2016) profile (left) and vs the Wang et al. (2025) profile (right). The error bars indicate 95% confidence intervals from the MCMC posterior. The dashed 1:1 line marks perfect agreement.
Current usage metrics show cumulative count of Article Views (full-text article views including HTML views, PDF and ePub downloads, according to the available data) and Abstracts Views on Vision4Press platform.
Data correspond to usage on the plateform after 2015. The current usage metrics is available 48-96 hours after online publication and is updated daily on week days.
Initial download of the metrics may take a while.