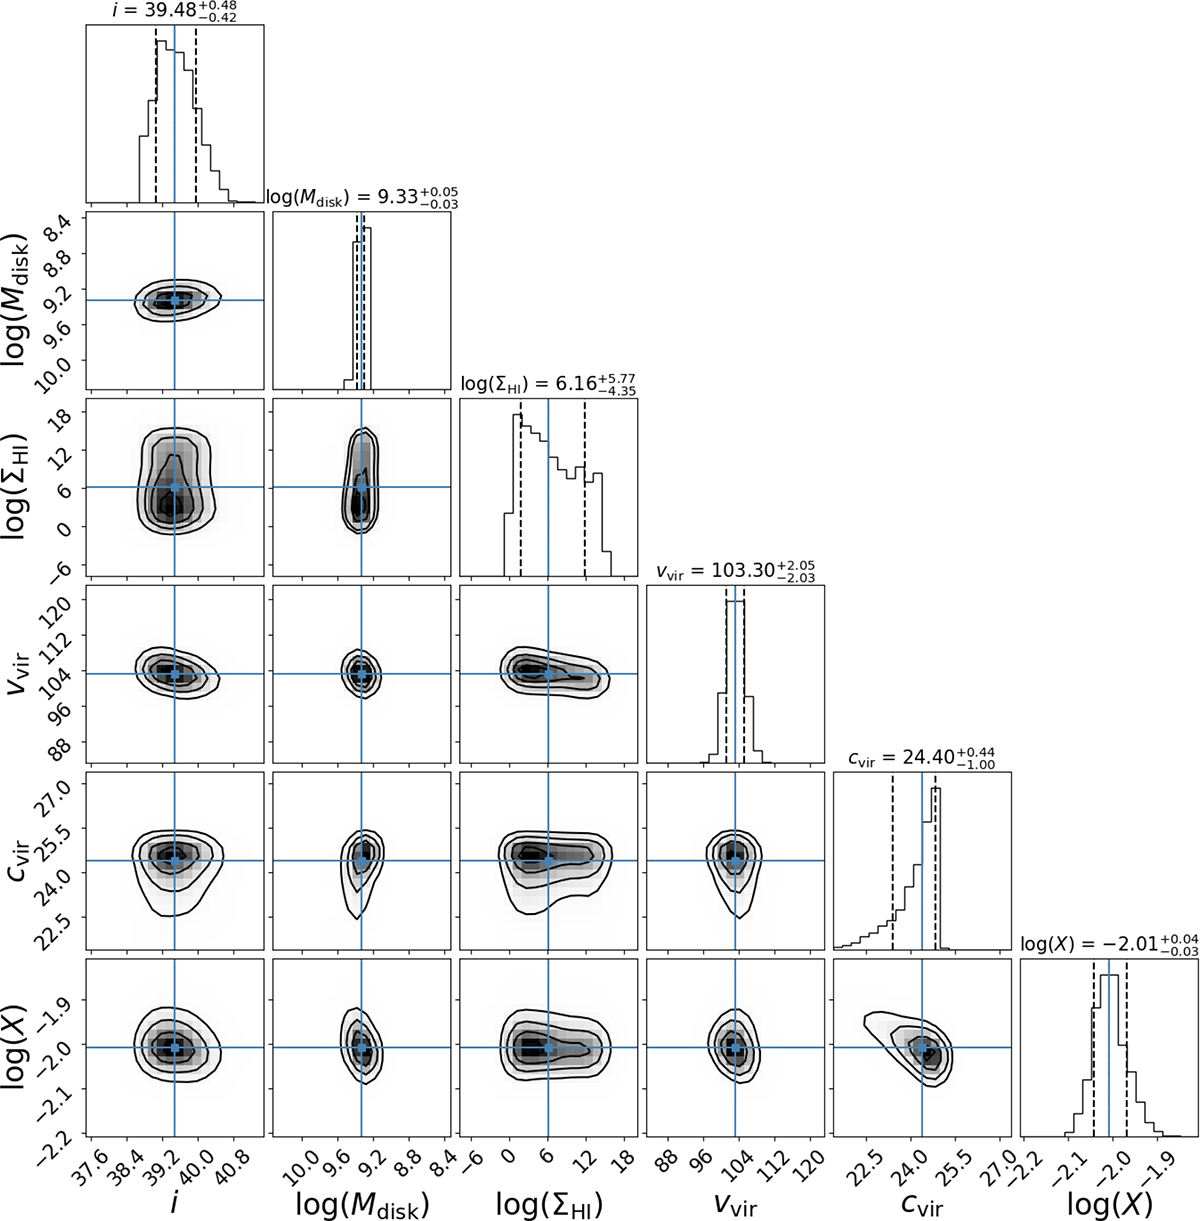
Fig. C.1.
Download original image
Corner plot for galaxy MXDF 26 showing the posterior distributions of the model parameters for the DC14 fits. The diagonal panels display the one-dimensional marginalised distributions for each parameter. The values of the best-fit parameters and associated errors (68% confidence intervals) are shown as the dashed blue and black lines, respectively. The off-diagonal panels show the two-dimensional joint distributions, highlighting correlations between parameters. Contours in the two-dimensional plots represent the 1σ, 2σ, and 3σ confidence regions.
Current usage metrics show cumulative count of Article Views (full-text article views including HTML views, PDF and ePub downloads, according to the available data) and Abstracts Views on Vision4Press platform.
Data correspond to usage on the plateform after 2015. The current usage metrics is available 48-96 hours after online publication and is updated daily on week days.
Initial download of the metrics may take a while.