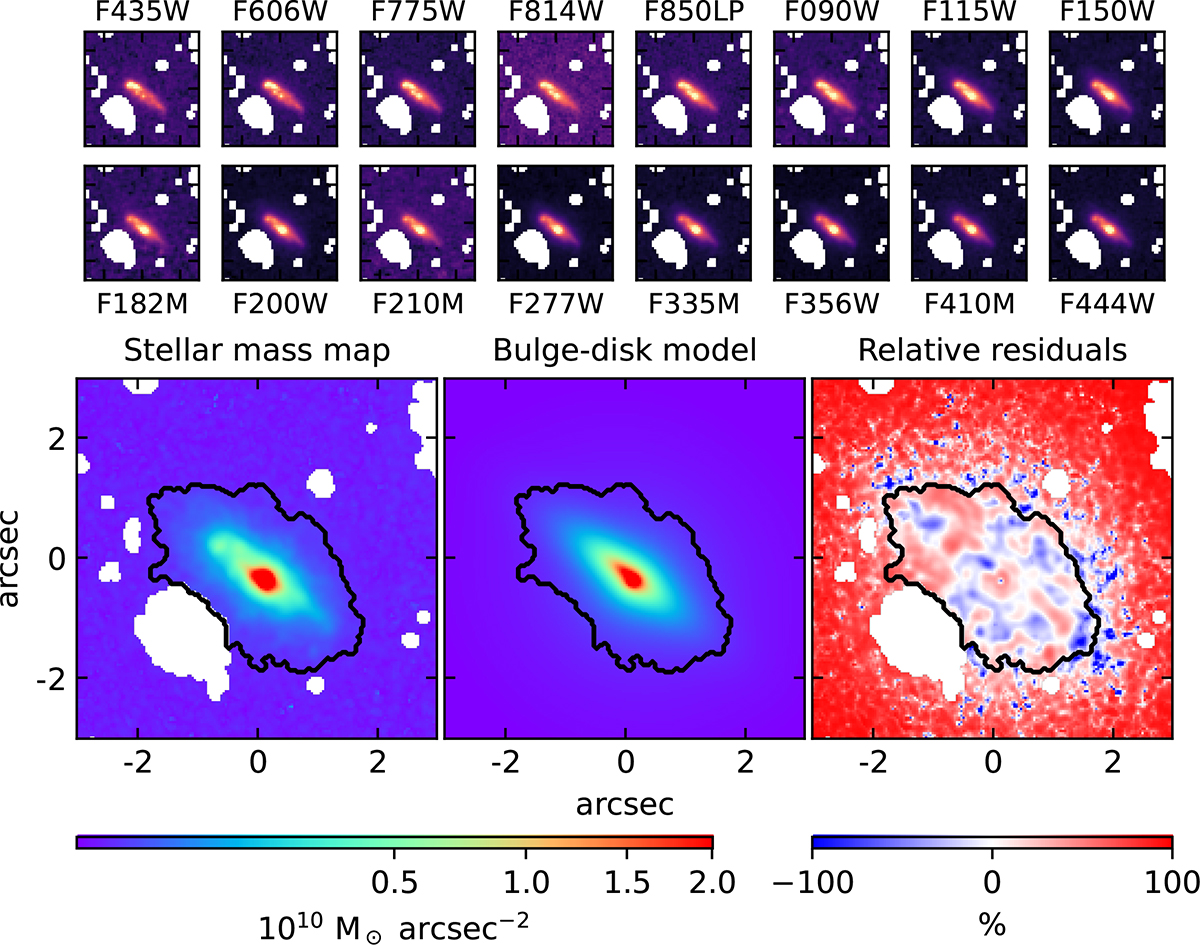
Fig. D.1.
Download original image
Example of a stellar mass map and its associated bulge-disk decomposition for galaxy 939, which has a B/T = 0.22. The top two rows show cutouts of the galaxy in the different HST and JWST bands that were used for the pixel-per-pixel SED fitting (arbitrary unit). The bottom row shows the reconstructed stellar mass map (left), the best-fit bulge-disk decomposition obtained on the mass map (middle), and the residuals (right). The black line denotes the limits of the galaxy as determined by the segmentation map provided as part of the JADES survey.
Current usage metrics show cumulative count of Article Views (full-text article views including HTML views, PDF and ePub downloads, according to the available data) and Abstracts Views on Vision4Press platform.
Data correspond to usage on the plateform after 2015. The current usage metrics is available 48-96 hours after online publication and is updated daily on week days.
Initial download of the metrics may take a while.