Fig. G.1.
Download original image
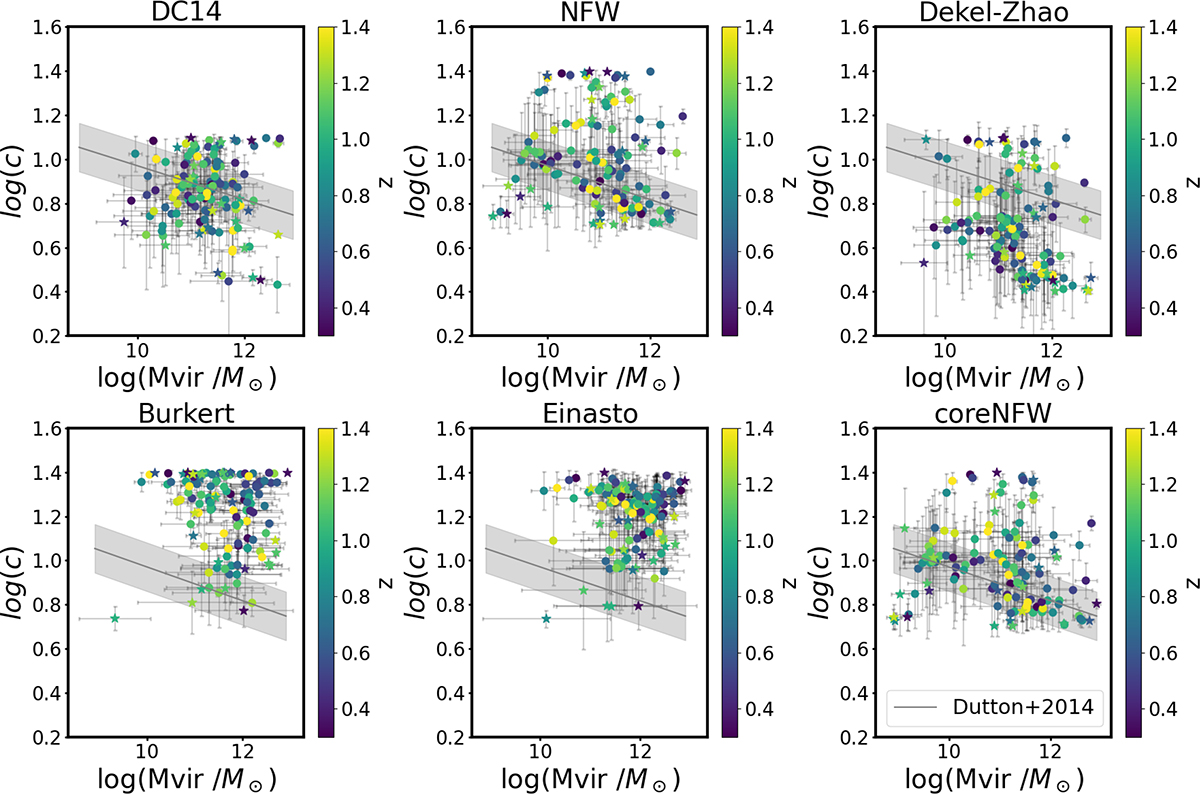
Concentration – halo mass relation for our sample using all six halo models. The solid grey line shows the cvir − Mvir relation from Dutton & Macció (2014) for the mean z of our sample, z = 0.85, while the shaded grey region shows the scatter of the relation. The circles depict the regular galaxies, whereas the stars represent the perturbed galaxies from our sample. The data points are colour-coded according to their z. To improve the readability, the error bars show the 65% CI (∼1σ symmetric errors).
Current usage metrics show cumulative count of Article Views (full-text article views including HTML views, PDF and ePub downloads, according to the available data) and Abstracts Views on Vision4Press platform.
Data correspond to usage on the plateform after 2015. The current usage metrics is available 48-96 hours after online publication and is updated daily on week days.
Initial download of the metrics may take a while.