Fig. 3.
Download original image
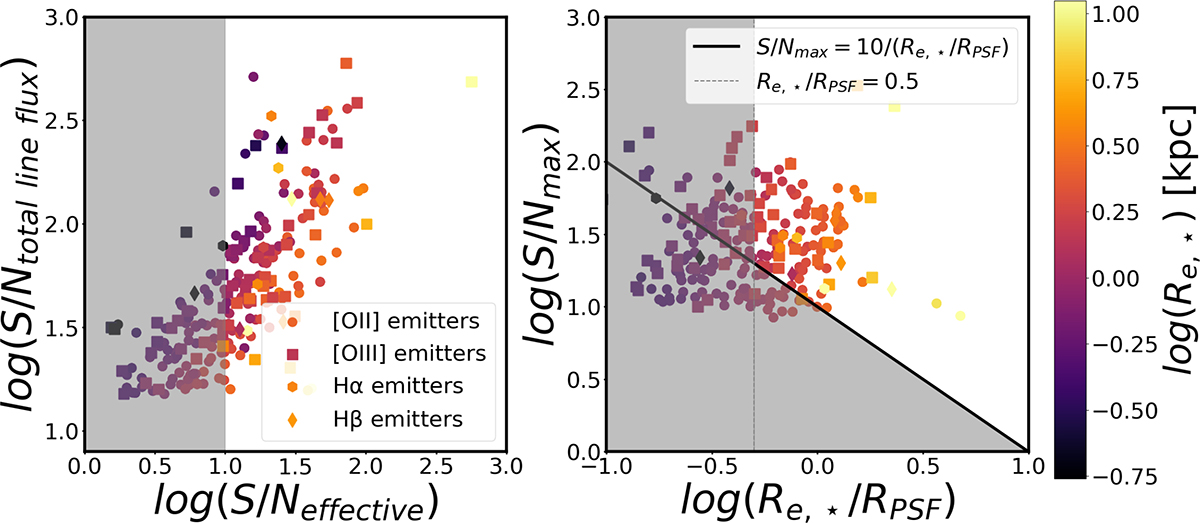
Left: Effective S/N for the brightest emission line using Eq. (3), as a function of the S/N of the total line flux from the integrated spectrum. Right: Ratio of the stellar half-light radius to the PSF radius as a function of the S/N in the brightest spaxel. The grey shaded area in the panels marks the exclusion region, i.e. all galaxies with S/Neff < 10 and Re/RPSF < 0.5 are removed from the sample. The data points are colour-coded according to their half-light radii. The circles, stars, diamonds, and squares represent the [OII], Hα, Hβ, and [OIII] emitters, respectively.
Current usage metrics show cumulative count of Article Views (full-text article views including HTML views, PDF and ePub downloads, according to the available data) and Abstracts Views on Vision4Press platform.
Data correspond to usage on the plateform after 2015. The current usage metrics is available 48-96 hours after online publication and is updated daily on week days.
Initial download of the metrics may take a while.