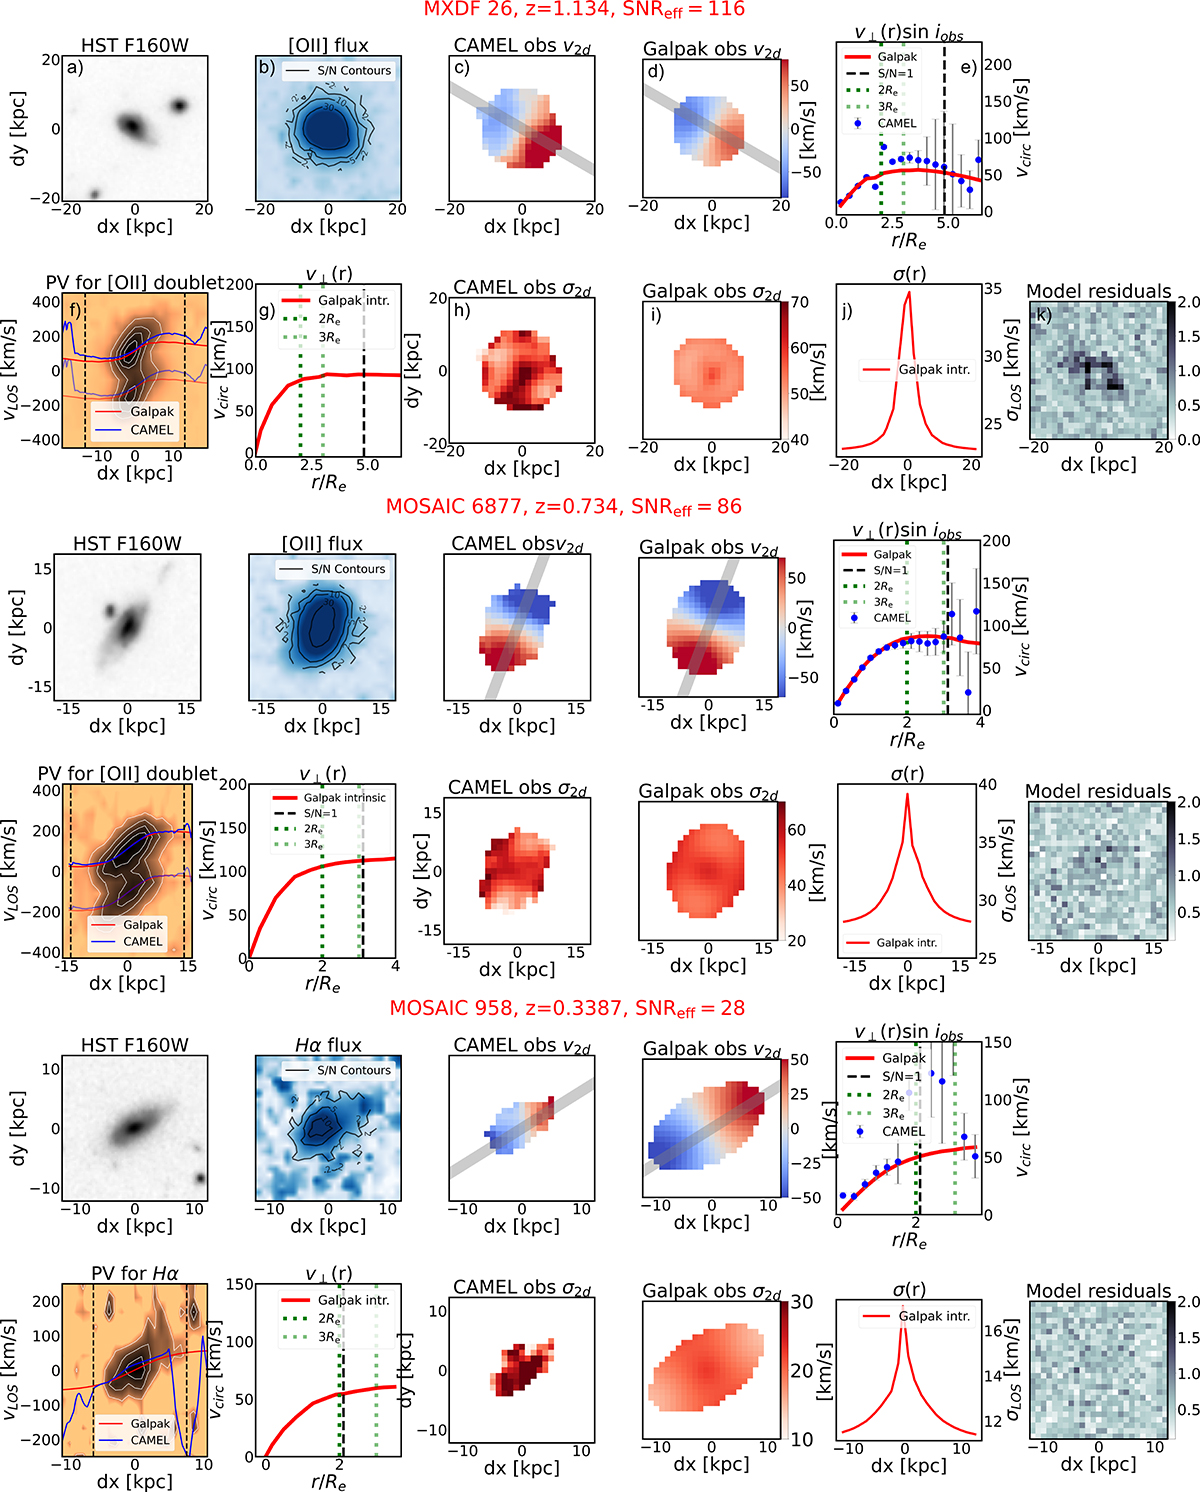
Fig. 6.
Download original image
Example of morpho-kinematic maps for three galaxies, ID 26, 6877, and 958, covering the range of S/N ∼28 − 116. For each galaxy, the 11 panels show (a) the HST F160W image; (b) the emission-line flux map, with the S/N contours overlaid; (c+d) the observed velocity maps in [km/s] with the CAMEL (Epinat et al. 2012) and with GALPAK3D (URC), with the grey line showing the major-axis; (e) the observed velocity profile v⊥(r)sin(i)obs extracted along the major-axis; (f) the position-velocity diagram extracted along the major-axis; (g) the intrinsic velocity profile v⊥(r), i.e. corrected for inclination and instrumental effects; (h+i) the observed velocity dispersion maps in [km/s]; (j) the intrinsic velocity dispersion profile in [km/s]; and (k) the residuals map derived by computing the standard deviation along the wavelength axis of the normalised residual cube (see Bouché et al. 2022). In panels e, f, and g, the vertical dashed black line represents the radius at which the S/N ≃1, whereas the vertical dotted (light) green lines represent (3Re) 2Re.
Current usage metrics show cumulative count of Article Views (full-text article views including HTML views, PDF and ePub downloads, according to the available data) and Abstracts Views on Vision4Press platform.
Data correspond to usage on the plateform after 2015. The current usage metrics is available 48-96 hours after online publication and is updated daily on week days.
Initial download of the metrics may take a while.