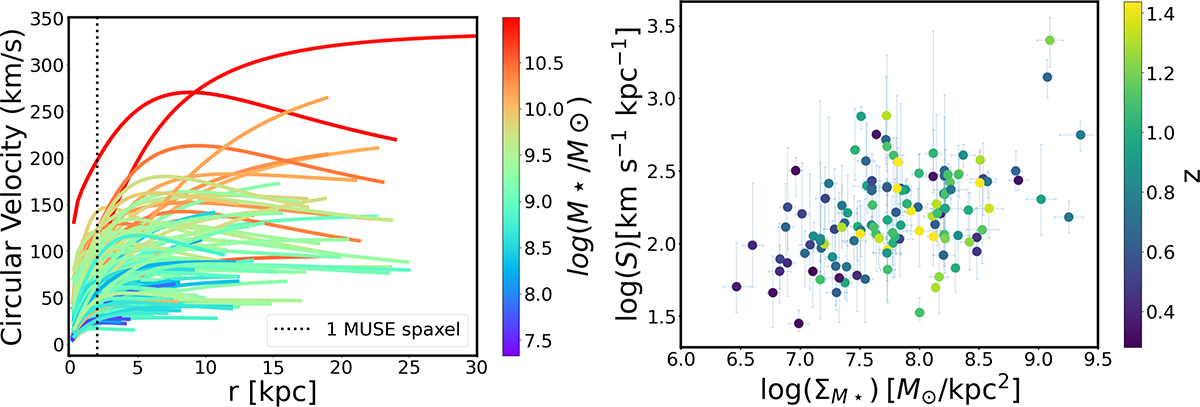
Fig. 7.
Download original image
Left: RCs (using the URC model, Sect. 2.1) of our sample of intermediate-z SFGs, colour-coded by stellar mass. The dotted black line shows the physical extent of 1 MUSE spaxel at z ∼ 1, namely 1.65 [kpc]. Right: Inner RC slopes, S (corrected for inclination), as a function of the stellar mass surface density. The data points are colour-coded according to their z. The error bars on the y-axis show the 95% confidence intervals from our 3D kinematic modelling, while the x-axis shows the 1σ uncertainties in ΣM★.
Current usage metrics show cumulative count of Article Views (full-text article views including HTML views, PDF and ePub downloads, according to the available data) and Abstracts Views on Vision4Press platform.
Data correspond to usage on the plateform after 2015. The current usage metrics is available 48-96 hours after online publication and is updated daily on week days.
Initial download of the metrics may take a while.