Fig. 8.
Download original image
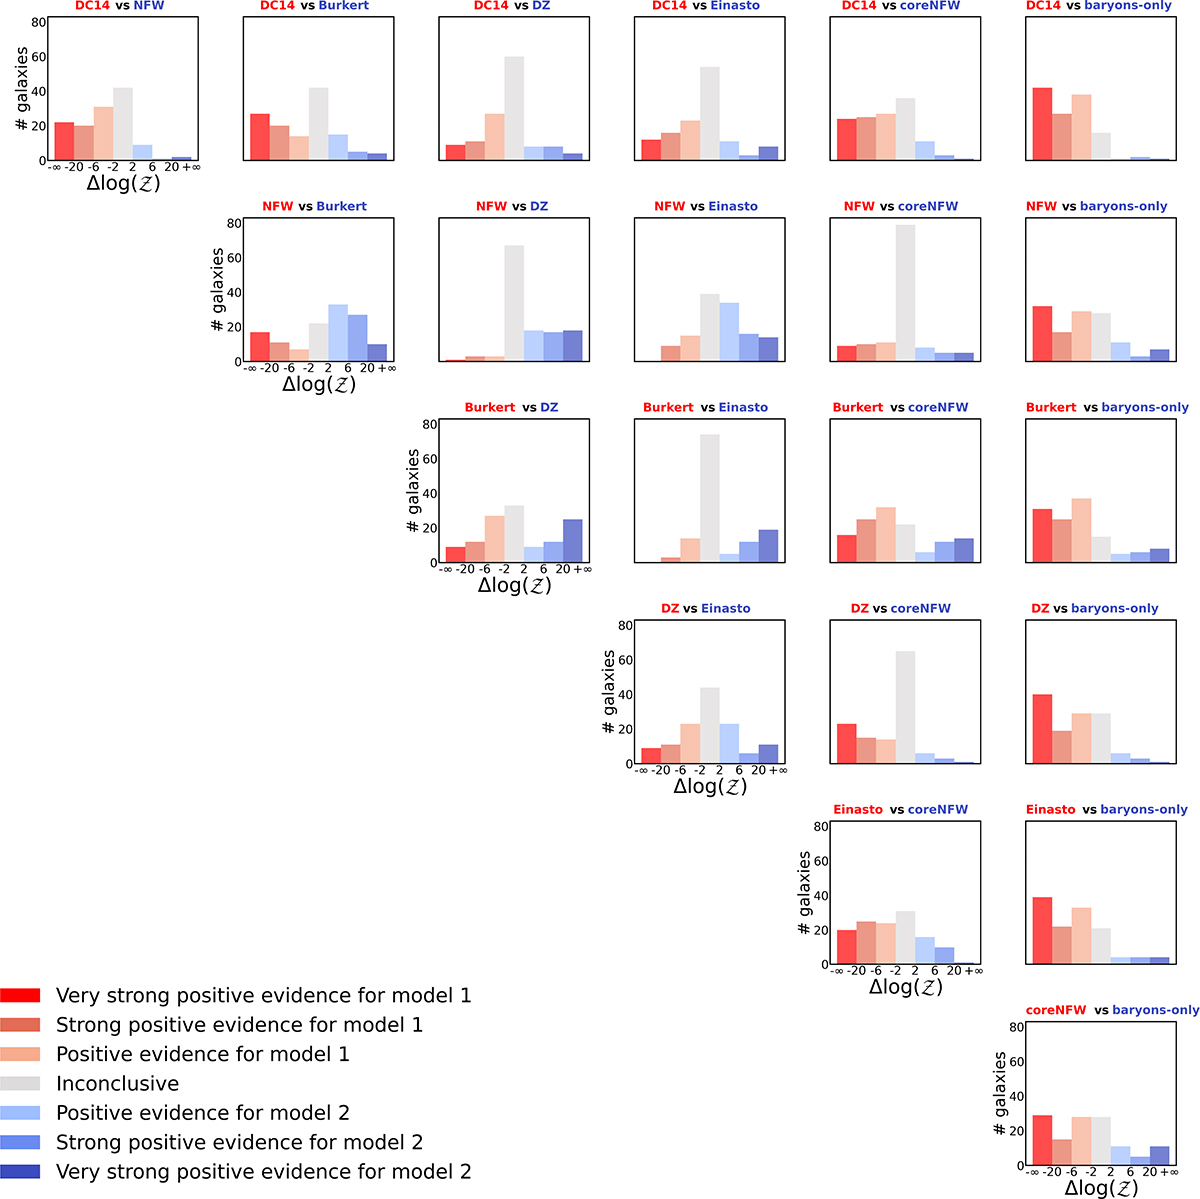
Histograms showing the Bayes factor for all the pairs of halo models used in this study. The red columns show the number of galaxies that display a very strong positive evidence towards the first model, i.e. which have −103 < Δ log(𝒵) < −20. The two lighter red columns depict the number of galaxies that show strong positive evidence and positive evidence for the first model, i.e. which have −20 < Δ log(𝒵) < −6 and −6 < Δ log(𝒵) < −2, respectively. The blue columns show the number of galaxies that show very strong positive evidence for the second model, i.e. 20 < Δ log(𝒵) < 103, while the lighter blue columns display the number of systems that show strong positive evidence and positive evidence for the second model, namely 6 < Δ log(𝒵) < 20 and 2 < Δ log(𝒵) < 6, respectively. The grey columns display the number of galaxies for which both models perform similarly, having −2 < Δ log(𝒵) < 2. In each panel, model 1 refers to the first model listed in the title, while model 2 refers to the second model.
Current usage metrics show cumulative count of Article Views (full-text article views including HTML views, PDF and ePub downloads, according to the available data) and Abstracts Views on Vision4Press platform.
Data correspond to usage on the plateform after 2015. The current usage metrics is available 48-96 hours after online publication and is updated daily on week days.
Initial download of the metrics may take a while.