Fig. 9.
Download original image
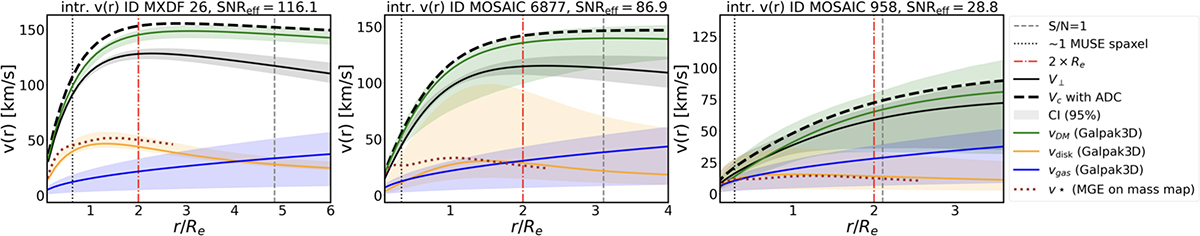
Examples of the 3D disk-halo decomposition for the three galaxies show in Fig. 6 using a DC14 DM profile (Eq. (A.1)). The solid black line represents the rotational velocity v⊥(r). The thick dashed black line represents the circular velocity vc(r), i.e. v⊥(r) corrected for pressure support (Sect. 2.2). The green curve represents the RC of the DM component. The solid orange and blue curves represent the disk and H I components, respectively. The light shaded regions show the 95% confidence intervals. The dotted brown lines represent the stellar component obtained using the MGE modelling of the stellar mass maps (see Sect. 5.2.1). All velocities are intrinsic, i.e. corrected for inclination and instrumental effects, including seeing (PSF). The black dotted line shows the physical extent of a MUSE spaxel, the dot-dashed red line shows 2 × Re, while the dashed grey line shows the region beyond which S/N < 1.
Current usage metrics show cumulative count of Article Views (full-text article views including HTML views, PDF and ePub downloads, according to the available data) and Abstracts Views on Vision4Press platform.
Data correspond to usage on the plateform after 2015. The current usage metrics is available 48-96 hours after online publication and is updated daily on week days.
Initial download of the metrics may take a while.