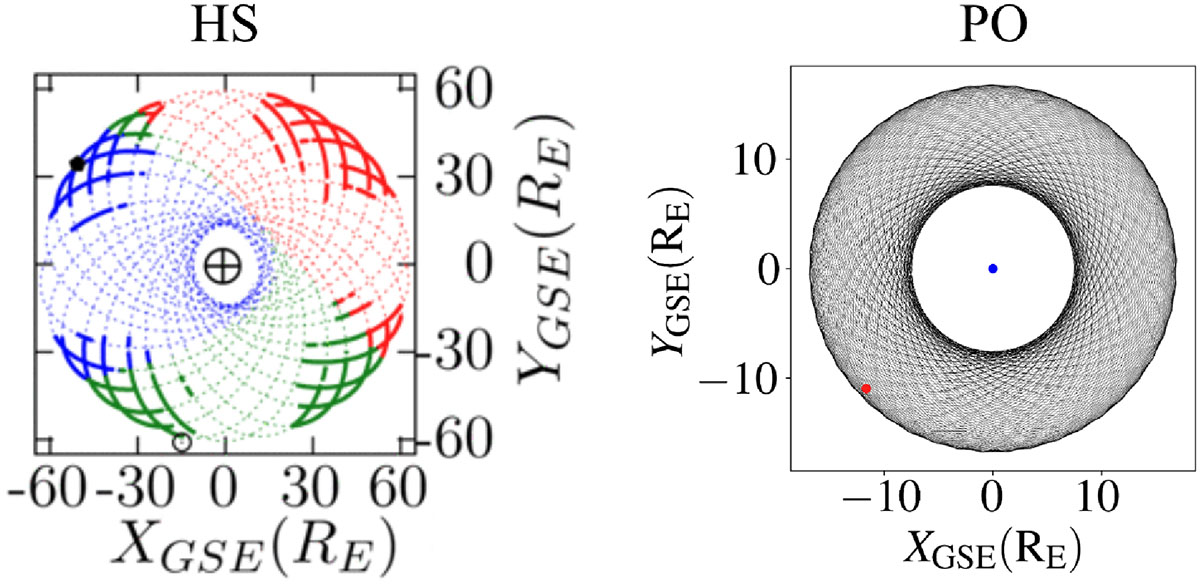
Fig. 1.
Download original image
Orbital plot showing the precession of the HS (left) and PO (right) observatory trajectories around the Earth (⨁ for HS and blue dot for PO), with regions of interest highlighted in blue (magnetosphere), red (solar wind), and green (foreshock) for HS. The thick lines in the HS plot indicate hours with ideal 3D multiscale coverage. The specific configuration we analyzed is marked with a black (red) dot for HS (PO). At this scale, it is not possible to distinguish individual spacecraft trajectories.
Current usage metrics show cumulative count of Article Views (full-text article views including HTML views, PDF and ePub downloads, according to the available data) and Abstracts Views on Vision4Press platform.
Data correspond to usage on the plateform after 2015. The current usage metrics is available 48-96 hours after online publication and is updated daily on week days.
Initial download of the metrics may take a while.