Fig. 7.
Download original image
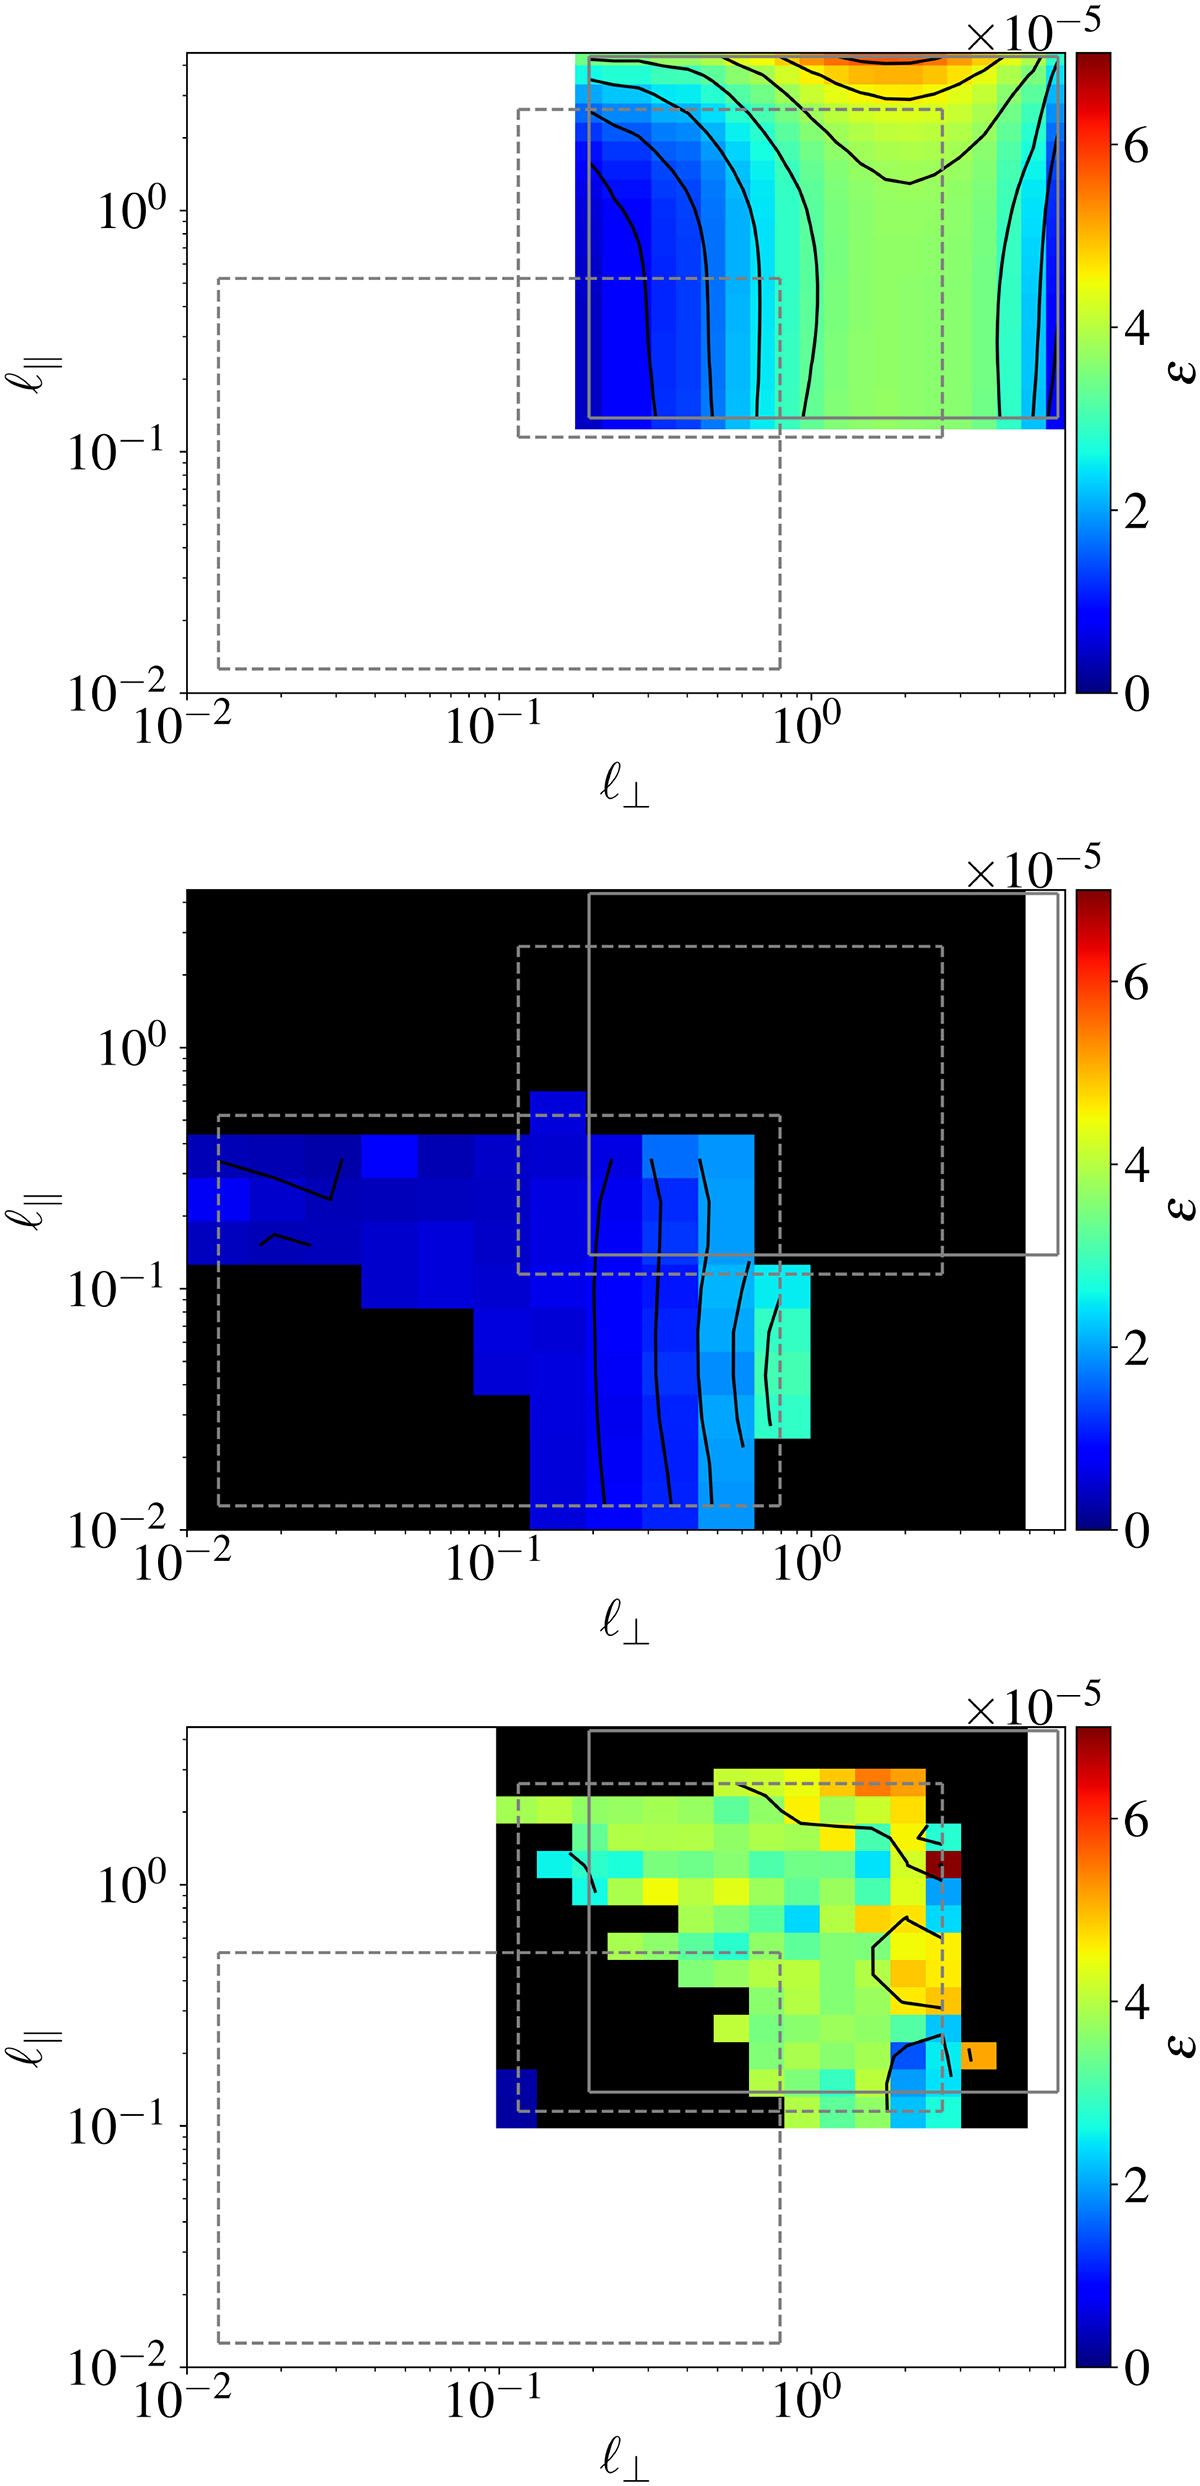
Anisotropic energy cascade rate ϵ(ℓ⊥, ℓ∥) in the parallel-perpendicular increment plane (assuming gyrotropy). Top: Full simulation grid solution (benchmark). Middle: HS with smaller separations (kinetic scales). Bottom: HS with larger separations (inertial scales). Even with limited coverage, HS recovers the scale-dependent anisotropic trend. Different configurations cover different portions of the increment space. The coverage on the simulation grid and HS are delimited with solid and dashed gray boxes, respectively. The black lines are isocontours of the energy transfer rate.
Current usage metrics show cumulative count of Article Views (full-text article views including HTML views, PDF and ePub downloads, according to the available data) and Abstracts Views on Vision4Press platform.
Data correspond to usage on the plateform after 2015. The current usage metrics is available 48-96 hours after online publication and is updated daily on week days.
Initial download of the metrics may take a while.