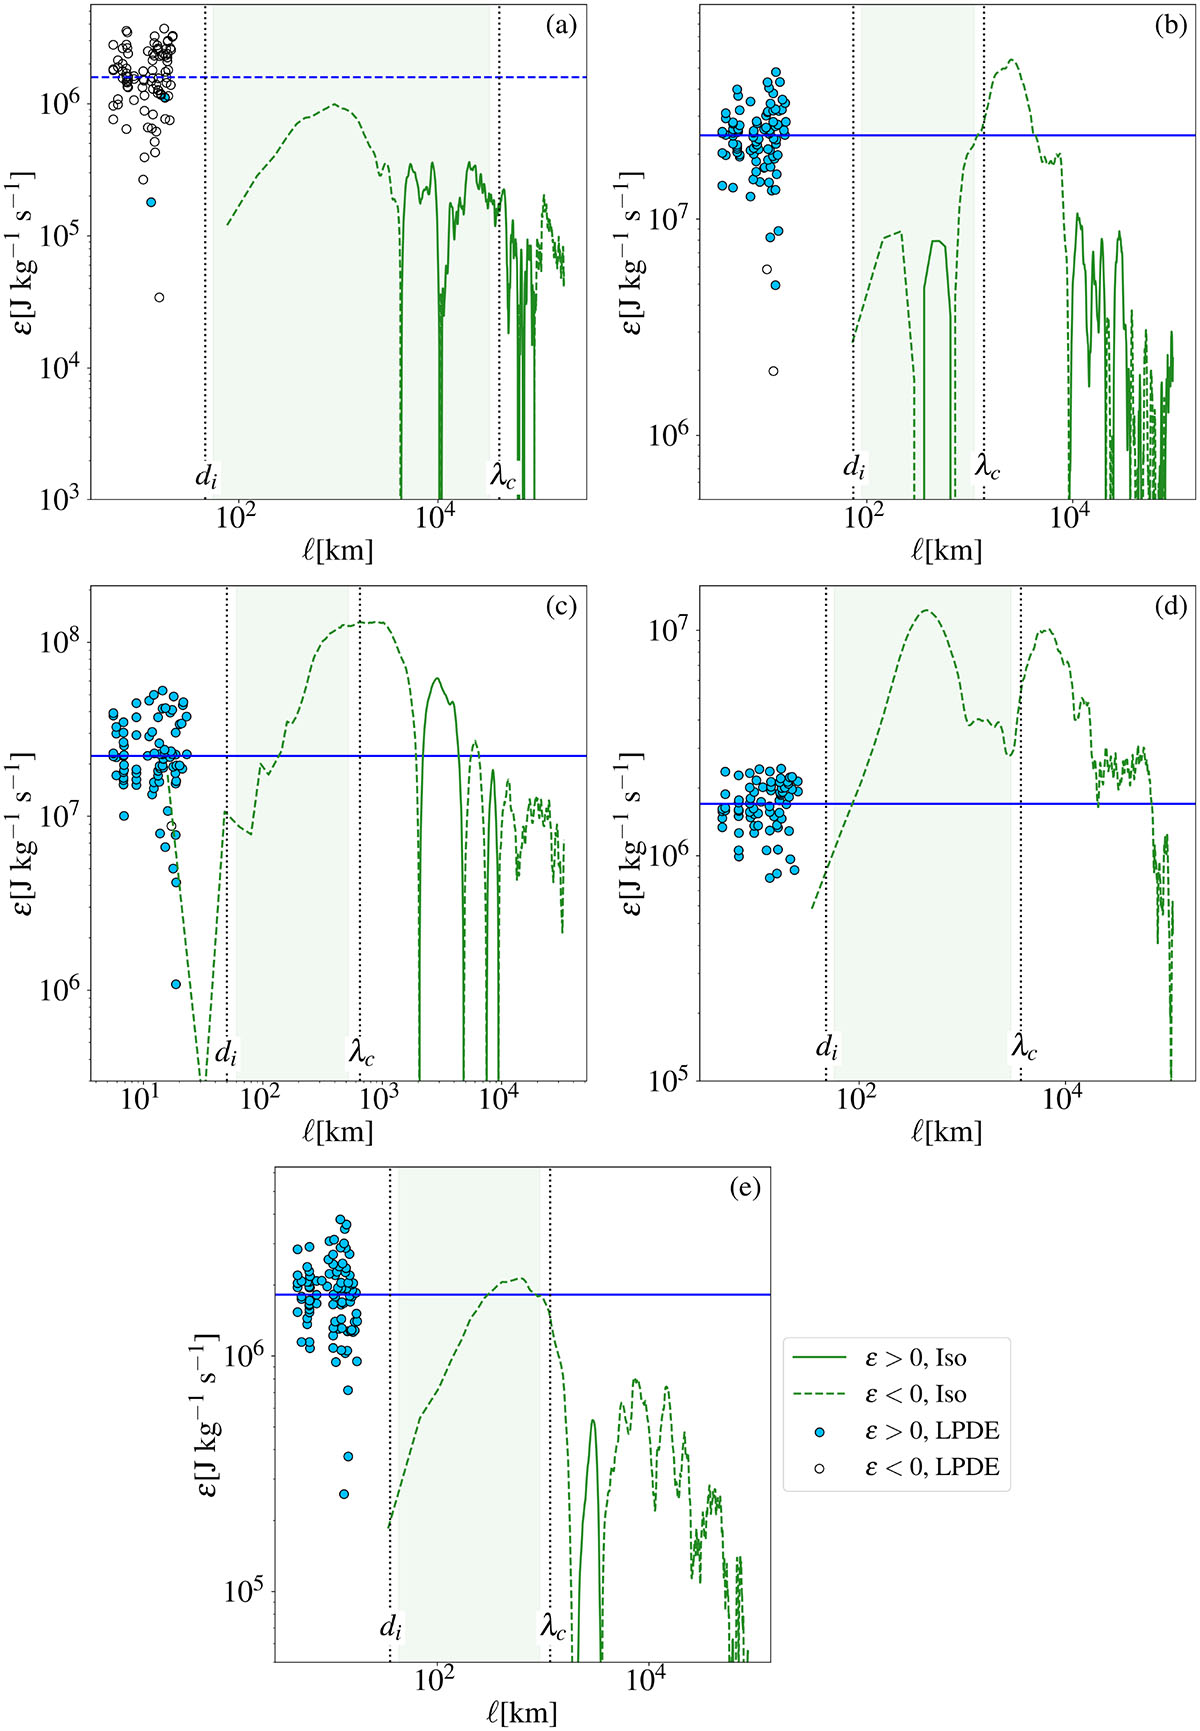
Fig. 8.
Download original image
Estimates of Eq. (2) (filled blue circles for positive ϵ, and white circles for negative ϵ) using LPDE. The horizontal line is the average value (solid for positive, dashed for negative). The isotropic estimate from Eq. (3) (solid green lines for positive values, and dashed lines for negative values). The ion inertial length di and the correlation length λc are indicated in each panel. The different estimates of the isotropic cascade rate were obtained within the shaded green areas between 1.2di and 0.8λc. Panels (a)-(e) correspond to intervals I-V, respectively.
Current usage metrics show cumulative count of Article Views (full-text article views including HTML views, PDF and ePub downloads, according to the available data) and Abstracts Views on Vision4Press platform.
Data correspond to usage on the plateform after 2015. The current usage metrics is available 48-96 hours after online publication and is updated daily on week days.
Initial download of the metrics may take a while.