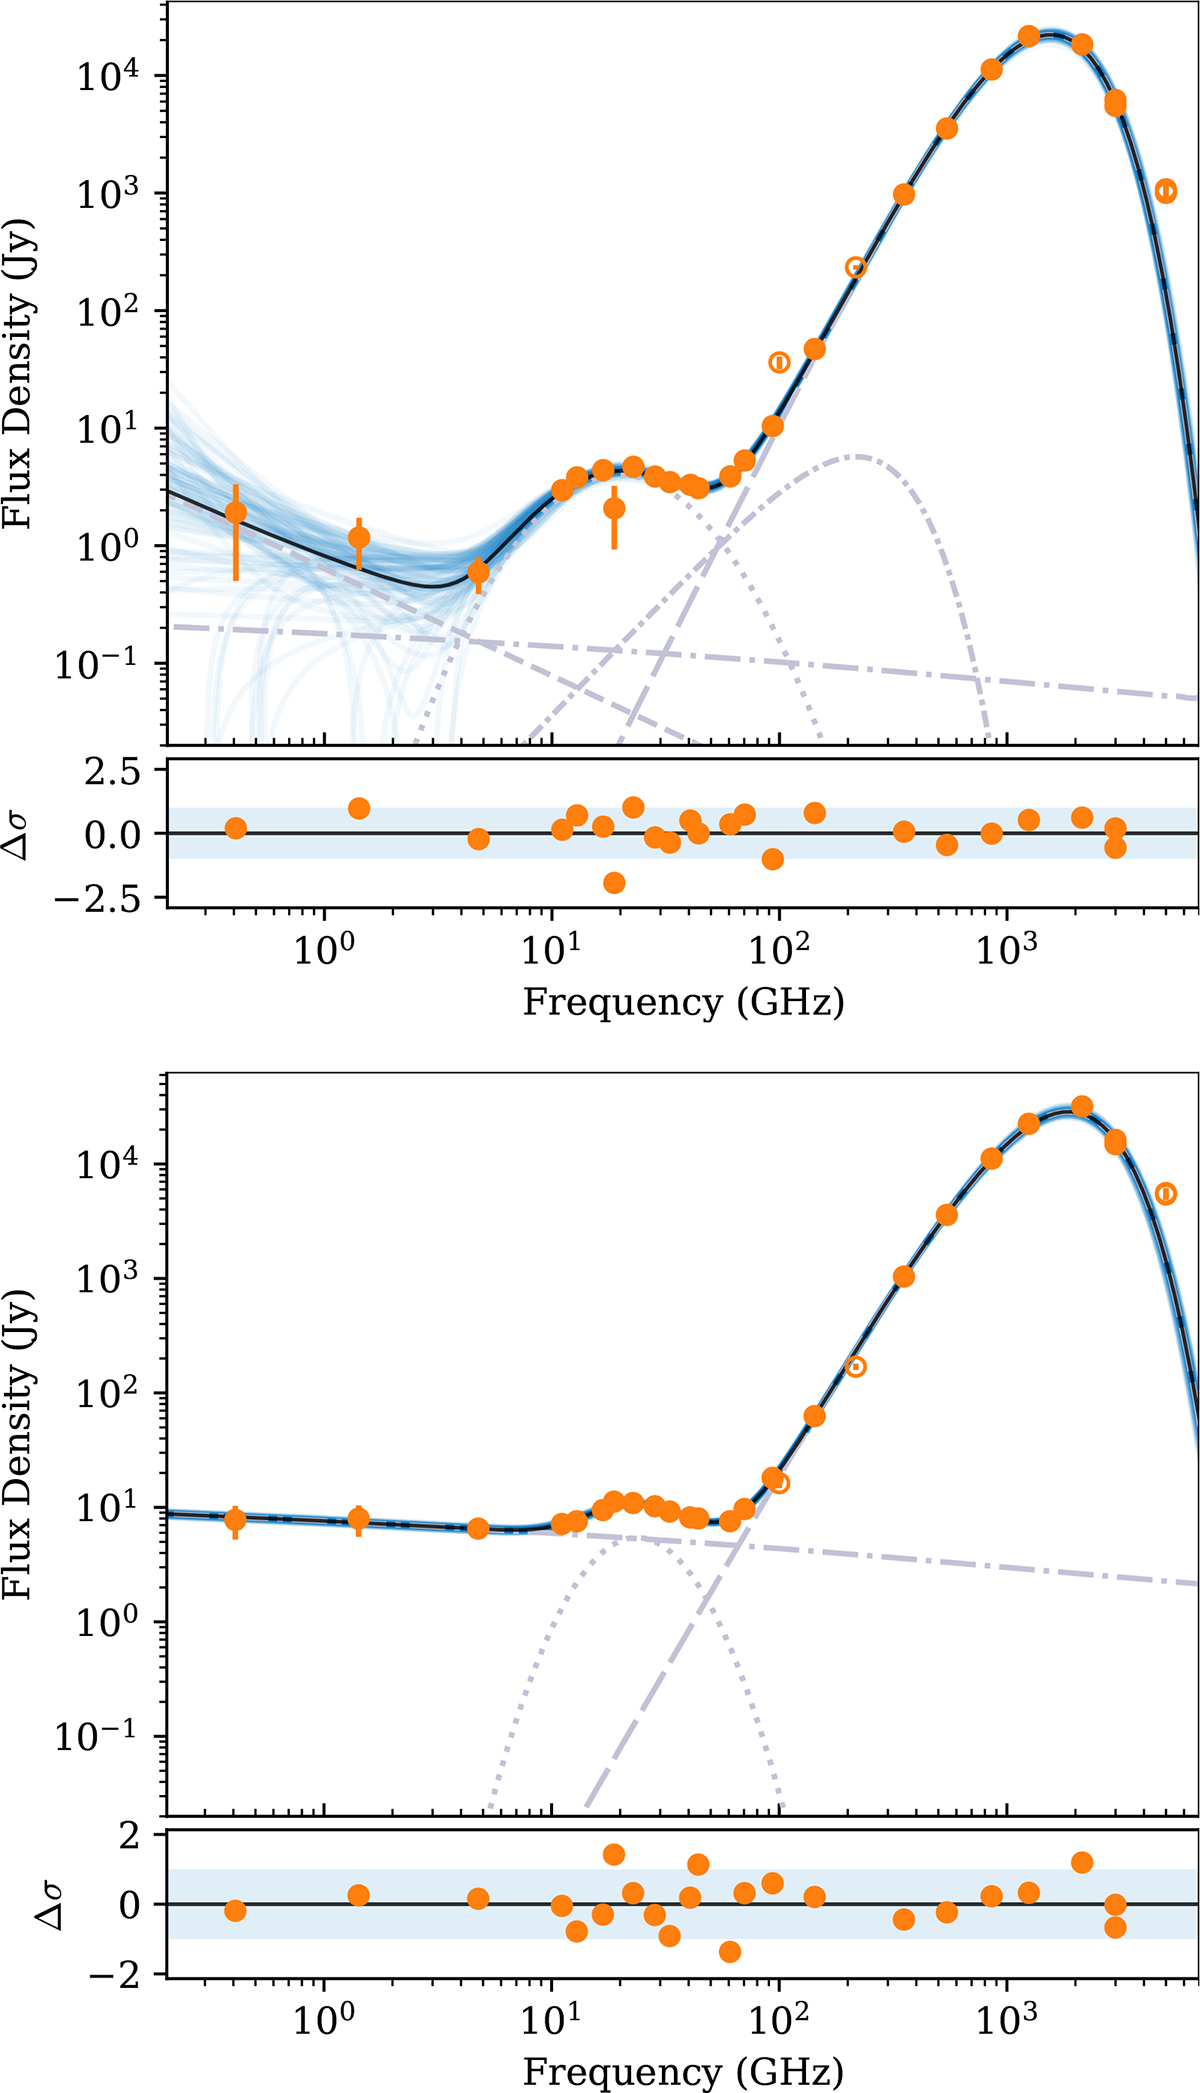
Fig. 1.
Download original image
Spectral energy distributions for two sources: G159.02-33.88 (top) and G195.90-02.60 (bottom). In each panel, the solid black line shows the best-fit model, with χred2 = 0.8 and 0.7, respectively. Individual realizations from the converged MCMC chain, illustrating model scatter, are shown in blue. Color-corrected flux densities are plotted as orange points, with hollow markers indicating data points excluded from the fit due to residual CO contamination or excessively high frequencies. Each individual best-fit model component is displayed in gray, with the dotted line representing the AME component. The lower sub-panels display residuals in units of statistical deviation from the fit, with the 1σ region shaded in light blue.
Current usage metrics show cumulative count of Article Views (full-text article views including HTML views, PDF and ePub downloads, according to the available data) and Abstracts Views on Vision4Press platform.
Data correspond to usage on the plateform after 2015. The current usage metrics is available 48-96 hours after online publication and is updated daily on week days.
Initial download of the metrics may take a while.