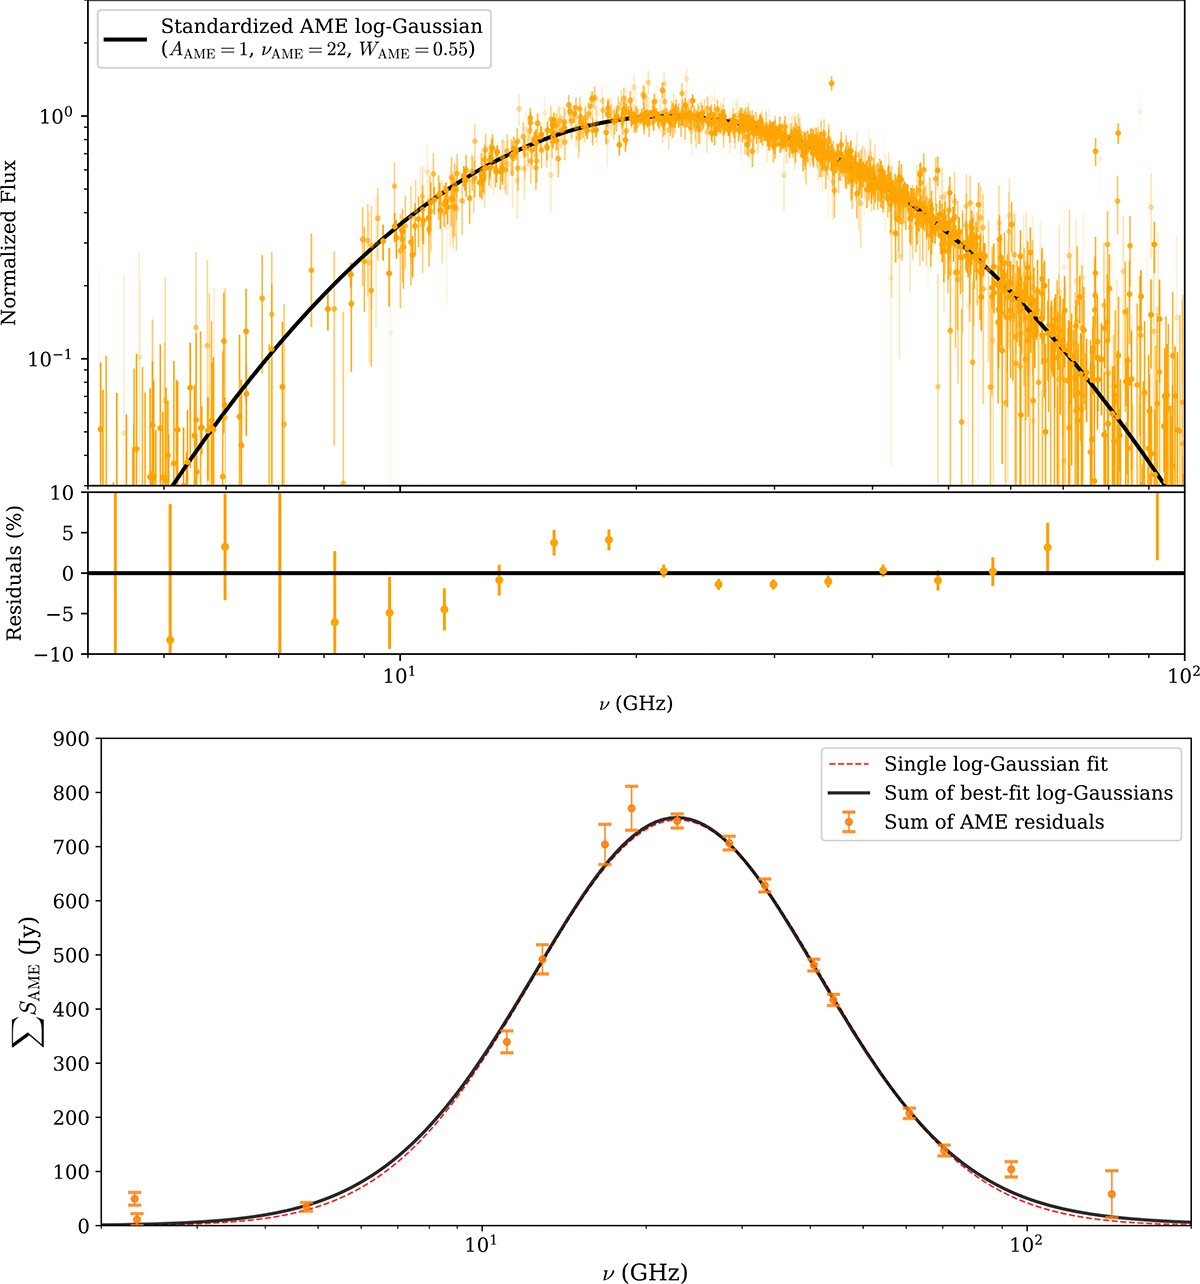
Fig. 10.
Download original image
Residuals of the fit data after subtracting all non-AME components. Top panel: residuals relative to a normalized log-Gaussian distribution. A transparency gradient was applied to deemphasize points with large error bars and enhance visual clarity. The lower sub-panel shows the binned weighted mean residuals as percentages relative to the standardized model, with bins evenly spaced in logarithmic scale. Bottom panel: total fit AME flux densities (orange) in a linear y-scale compared with the sum of best-fit log-Gaussian components (black). The sum only includes the 85 sources with simultaneous QUIJOTE and C-BASS coverage. A single log-Gaussian distribution fit to the AME residuals is shown as a dashed red line, with νAME = 22.8 GHz, WAME = 0.62 and χr2 = 3.1.
Current usage metrics show cumulative count of Article Views (full-text article views including HTML views, PDF and ePub downloads, according to the available data) and Abstracts Views on Vision4Press platform.
Data correspond to usage on the plateform after 2015. The current usage metrics is available 48-96 hours after online publication and is updated daily on week days.
Initial download of the metrics may take a while.