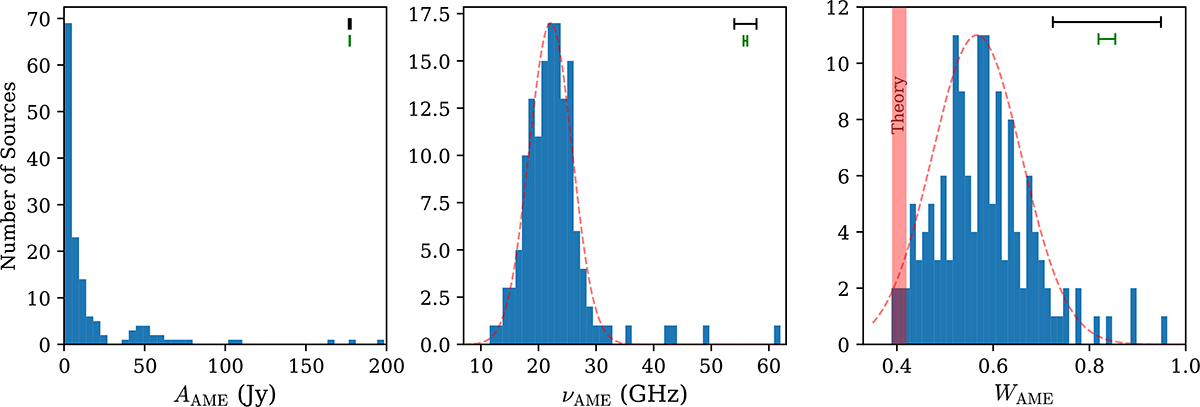
Fig. 4.
Download original image
Distributions of AME parameters in the source sample. Each panel includes an inset in the top-right showing the median (black) and smallest (green) 1σ uncertainties for that parameter among all sources. For AAME, the median and smallest uncertainties are 0.6 Jy and 0.1 Jy, respectively; the corresponding uncertainty bars are not visually discernible, as their horizontal caps are unresolved at the adopted linewidth. A best-fit Gaussian is drawn as a dashed red line on the νAME and WAME distributions. The red shaded region in the WAME panel highlights the range of effective widths predicted by single-phase SPDUST2 and SPYDUST templates (see Table 2).
Current usage metrics show cumulative count of Article Views (full-text article views including HTML views, PDF and ePub downloads, according to the available data) and Abstracts Views on Vision4Press platform.
Data correspond to usage on the plateform after 2015. The current usage metrics is available 48-96 hours after online publication and is updated daily on week days.
Initial download of the metrics may take a while.