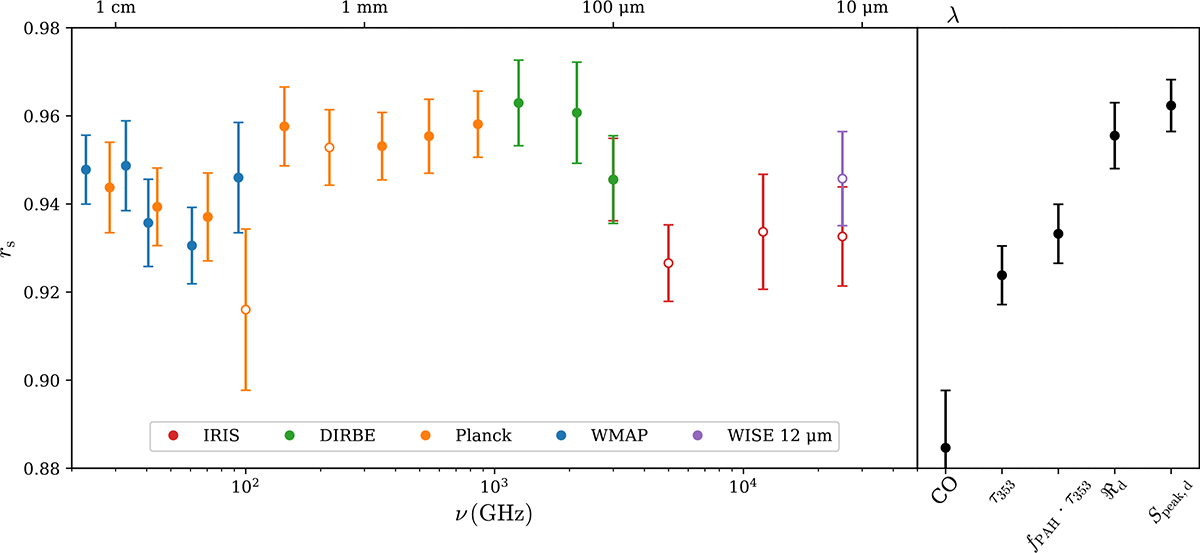
Fig. 7.
Download original image
Spearman correlation coefficients between AAME and individual frequency maps. Tracers are shown on the right, where CO denotes the 1–0 CO transition map by Ghosh et al. (2024) and Speak, d is the flux density at the peak of the thermal dust emission fit. In both cases, τ353 refers to the angular area-corrected optical depth τ353 ⋅ Ω. Hollow points denote frequencies that are excluded from the SED fitting. The 100 and 217 GHz bands are CO-subtracted.
Current usage metrics show cumulative count of Article Views (full-text article views including HTML views, PDF and ePub downloads, according to the available data) and Abstracts Views on Vision4Press platform.
Data correspond to usage on the plateform after 2015. The current usage metrics is available 48-96 hours after online publication and is updated daily on week days.
Initial download of the metrics may take a while.