Open Access
Fig. 9.
Download original image
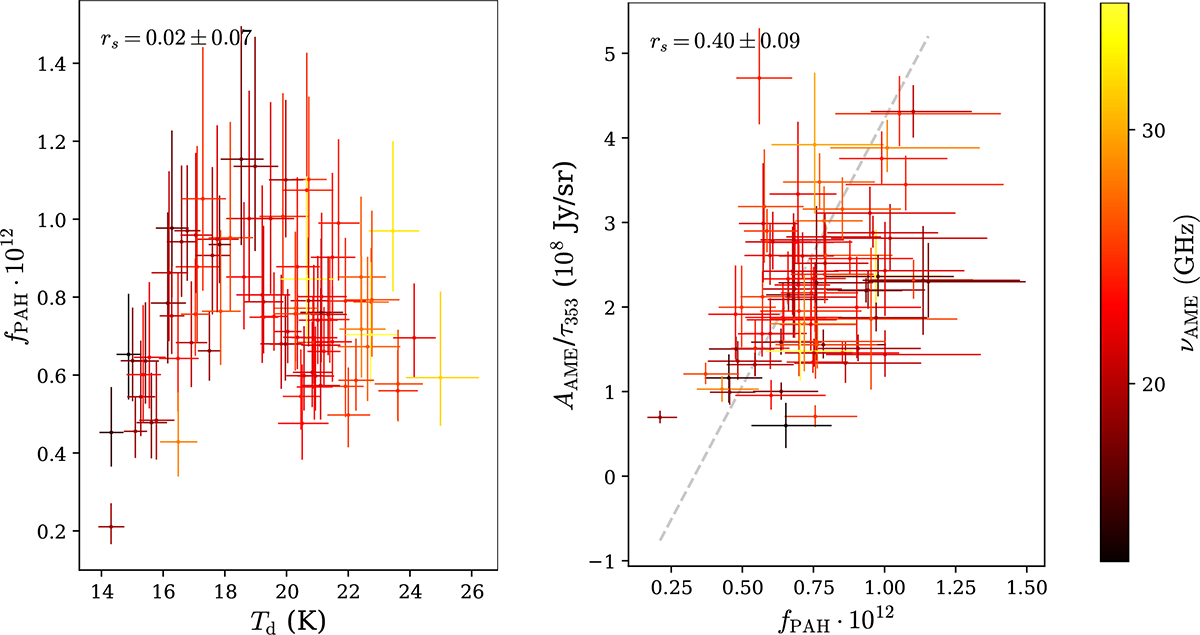
Left: relation between the fraction of PAHs traced at 12 μm, fPAH, and thermal dust temperature, showing an inflection point. Right: AME emissivity relative to τ353 (a tracer of total column density) as a function of fPAH, with a linear best-fit model shown by the gray dashed line. The color encodes AME peak frequency.
Current usage metrics show cumulative count of Article Views (full-text article views including HTML views, PDF and ePub downloads, according to the available data) and Abstracts Views on Vision4Press platform.
Data correspond to usage on the plateform after 2015. The current usage metrics is available 48-96 hours after online publication and is updated daily on week days.
Initial download of the metrics may take a while.