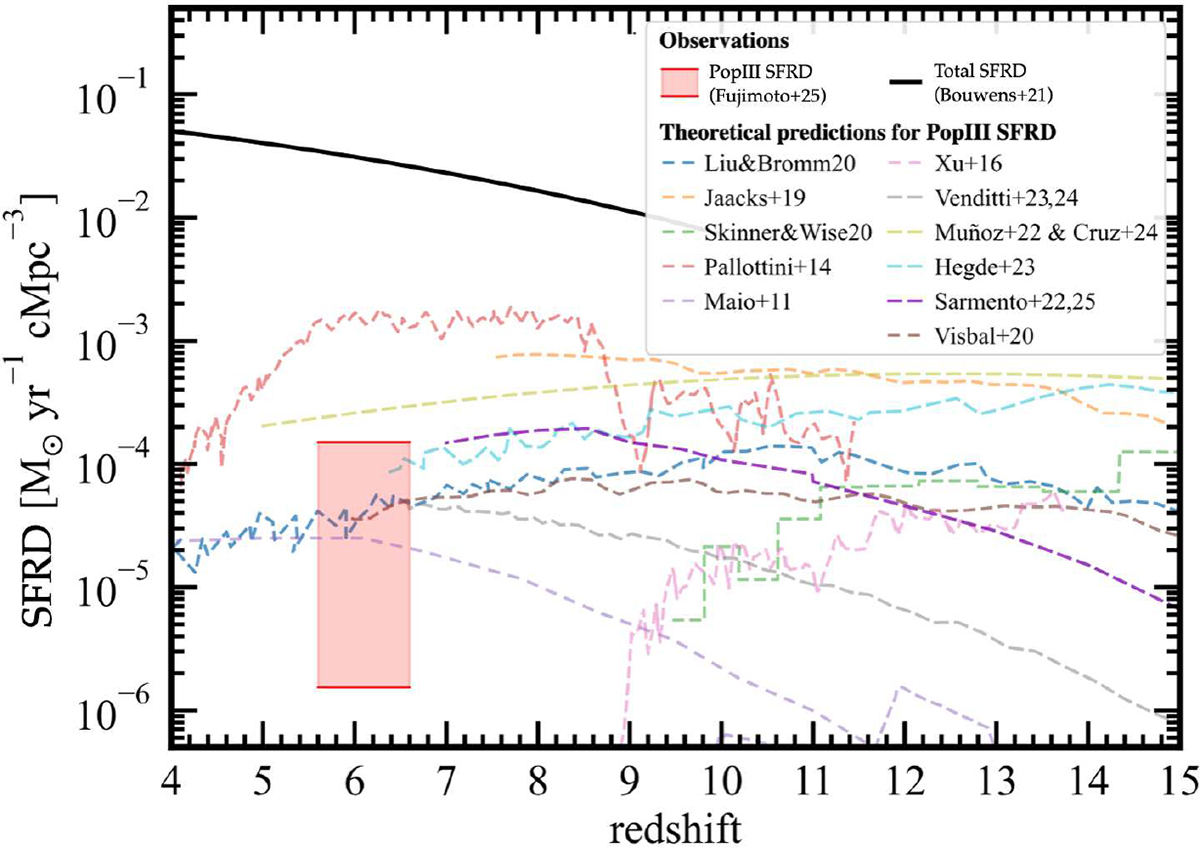
Fig. 14.
Download original image
Top-heavy PopIII SFRDs (broken lines) from simulations (Maio et al. 2010, 2011a, Pallottini et al. 2014, Xu et al. 2016, Jaacks et al. 2019, Liu & Bromm 2020, Skinner & Wise 2020, Venditti et al. 2023) and semi-analytical models (Visbal et al. 2020, Muñoz et al. 2022, Hegde & Furlanetto 2023, Sarmento & Scannapieco 2025) compared to total SFRD data (solid line) and JWST PopIII determinations (shaded area) taken from Fujimoto et al. (2025).
Current usage metrics show cumulative count of Article Views (full-text article views including HTML views, PDF and ePub downloads, according to the available data) and Abstracts Views on Vision4Press platform.
Data correspond to usage on the plateform after 2015. The current usage metrics is available 48-96 hours after online publication and is updated daily on week days.
Initial download of the metrics may take a while.