Fig. 16.
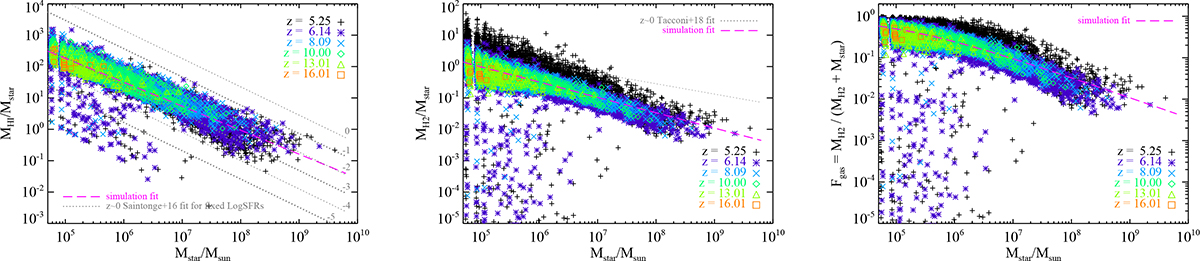
Download original image
Gas-to-star fractions, μHI (left), μH2 (centre), and Fgas = μH2/(1 + μH2) (right) as functions of Mstar compared to z ≃ 0 observational fits (dotted lines) for main-sequence galaxies (Saintonge et al. 2016, 2017; Tacconi et al. 2018). Different dotted lines in the left panel correspond to fixed Log(SFR/M⊙ yr−1) = 0, –1, –2, –3, –4, and –5, from top to bottom. Dashed magenta lines refer to simulation fits (Appendix F, Table F.2).
Current usage metrics show cumulative count of Article Views (full-text article views including HTML views, PDF and ePub downloads, according to the available data) and Abstracts Views on Vision4Press platform.
Data correspond to usage on the plateform after 2015. The current usage metrics is available 48-96 hours after online publication and is updated daily on week days.
Initial download of the metrics may take a while.