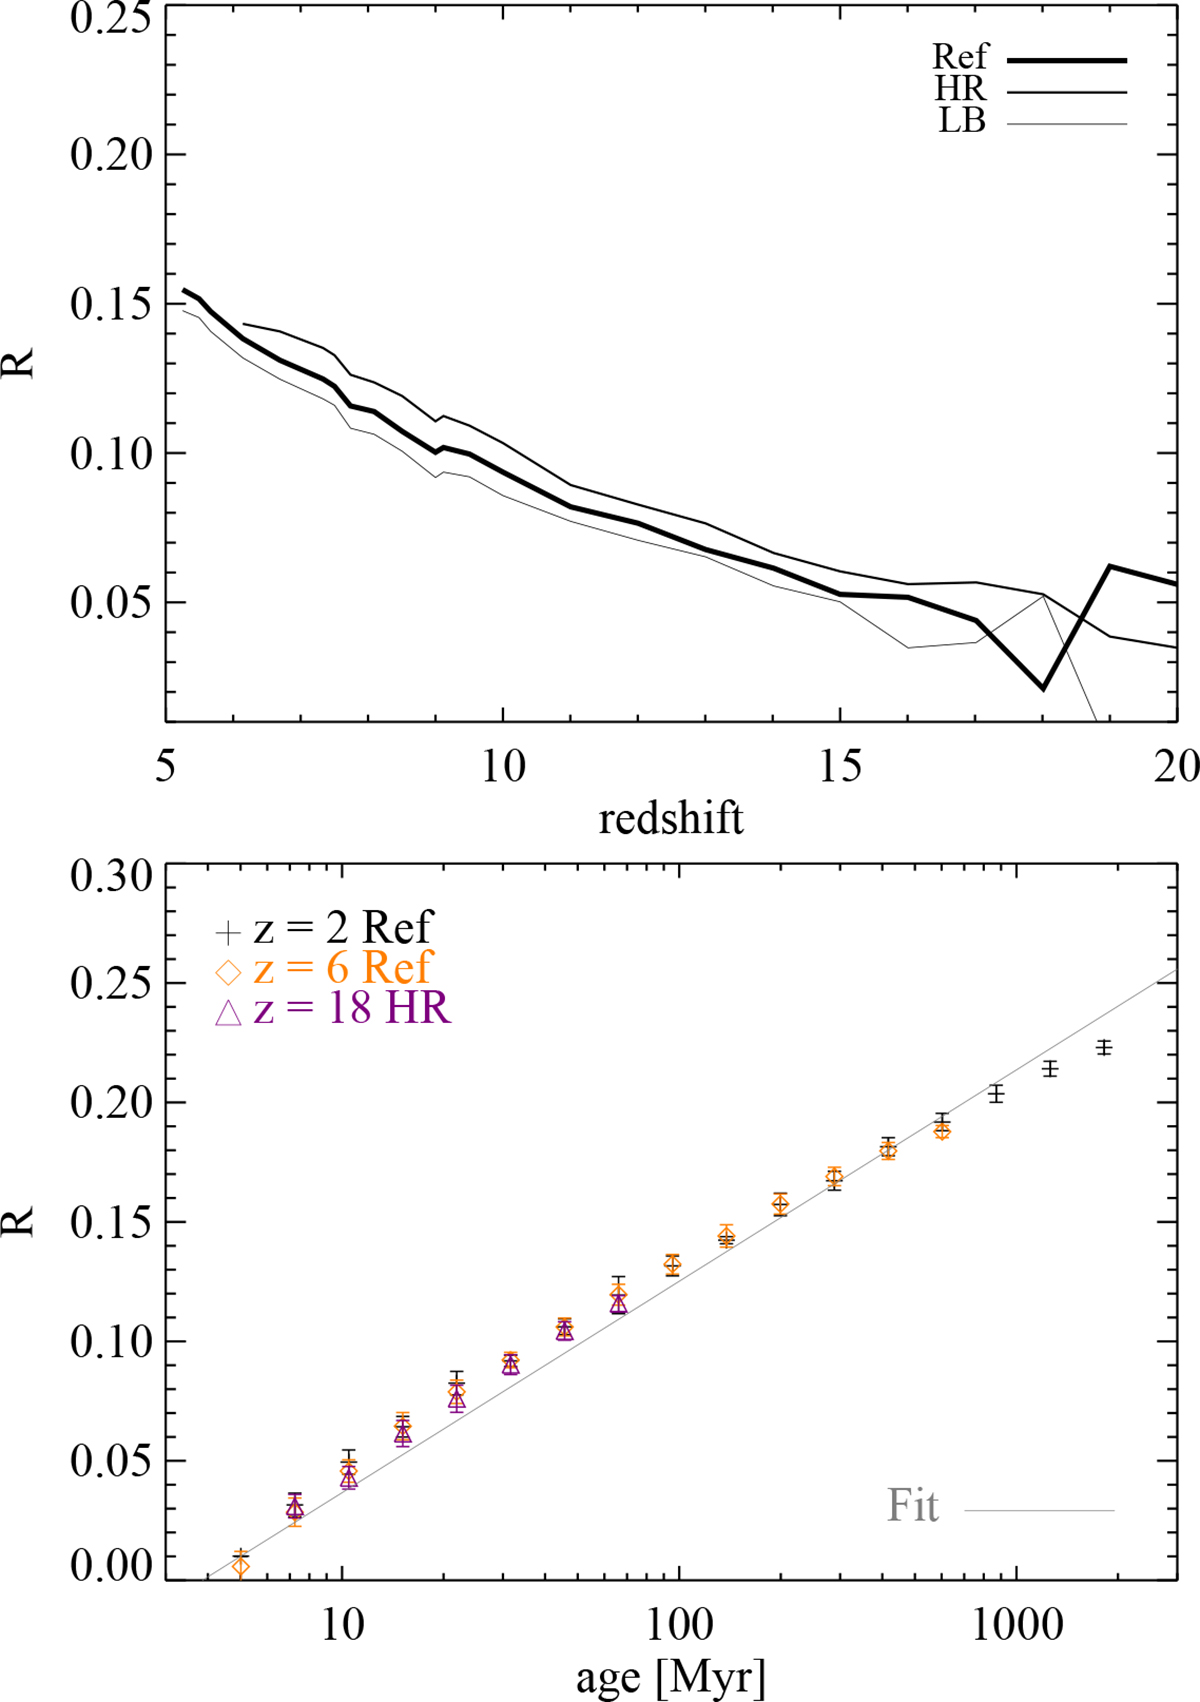
Fig. A.3.
Download original image
Top: Redshift evolution of the average R at different redshifts for the Ref (solid black lines), HR (dashed orange lines) and LB (dot-dot-dot-dashed purple lines) simulations. Bottom: Dependence of R on stellar age at z ≃ 2 (crosses), 6 (diamonds) and 18 (triangles), plotted together with the fitting function of eq. 2 (solid line).
Current usage metrics show cumulative count of Article Views (full-text article views including HTML views, PDF and ePub downloads, according to the available data) and Abstracts Views on Vision4Press platform.
Data correspond to usage on the plateform after 2015. The current usage metrics is available 48-96 hours after online publication and is updated daily on week days.
Initial download of the metrics may take a while.