Fig. C.1.
Download original image
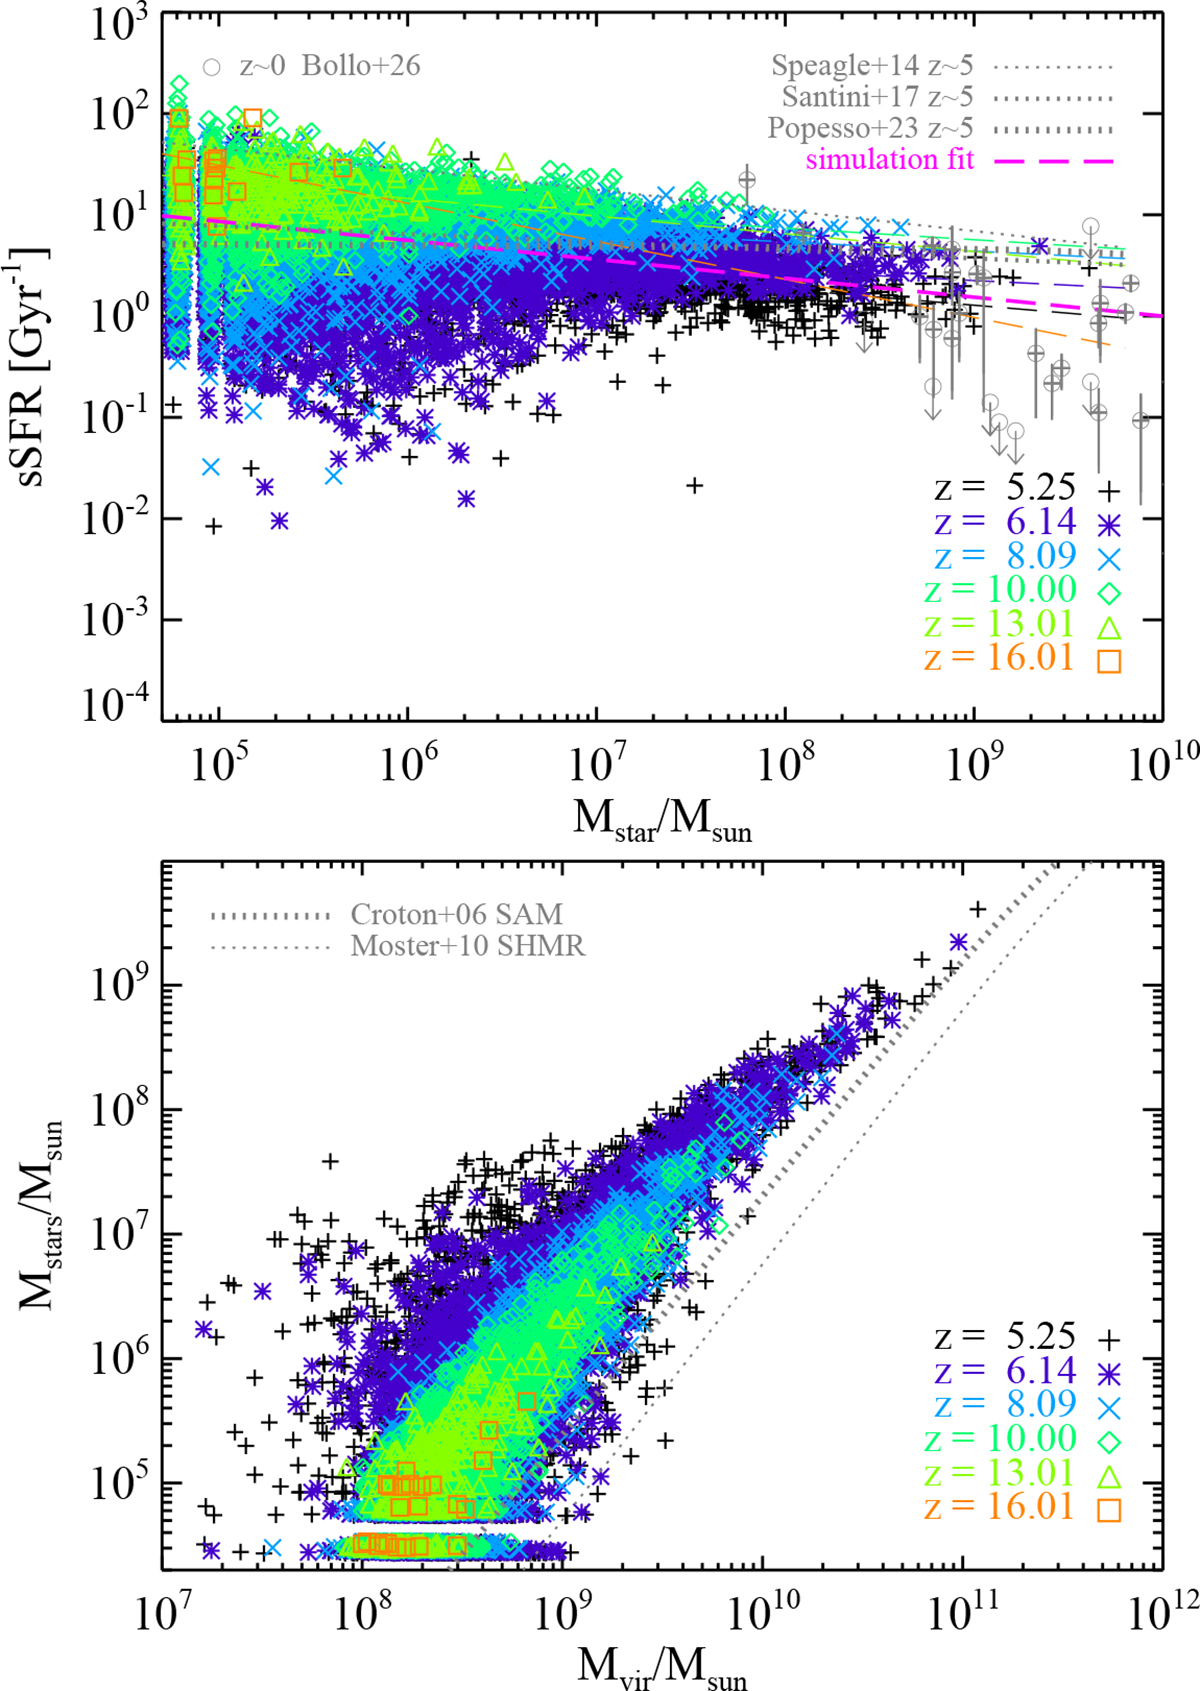
Top: Simulated sSFR and Mstar at different z (coloured symbols), z ≃ 5 observational fits by Speagle et al. (2014), Santini et al. (2017) and Popesso et al. (2023) (thin, regular and thick dotted lines) and z ∼ 0.5 MUSE-ALMA determinations (circles) with upper limits (arrows) by Bollo et al. (2026). Fits to simulation data at each z (thin dashed lines) are displayed together with the fit to the whole simulated sample (thick dashed magenta line), as per eq. 1 and Table F.1: Log10(SFR/Gyr−1) = 1.871 − 0.187 Log10(Mstar/M⊙). Bottom: Simulated Mstar and Mvir and fits from a low-z semi-analytical model (Croton et al. 2006, SAM, thick dotted line) and the stellar-to-halo mass relation (Moster et al. 2010, SHMR, thin dotted line).
Current usage metrics show cumulative count of Article Views (full-text article views including HTML views, PDF and ePub downloads, according to the available data) and Abstracts Views on Vision4Press platform.
Data correspond to usage on the plateform after 2015. The current usage metrics is available 48-96 hours after online publication and is updated daily on week days.
Initial download of the metrics may take a while.