Fig. 4.
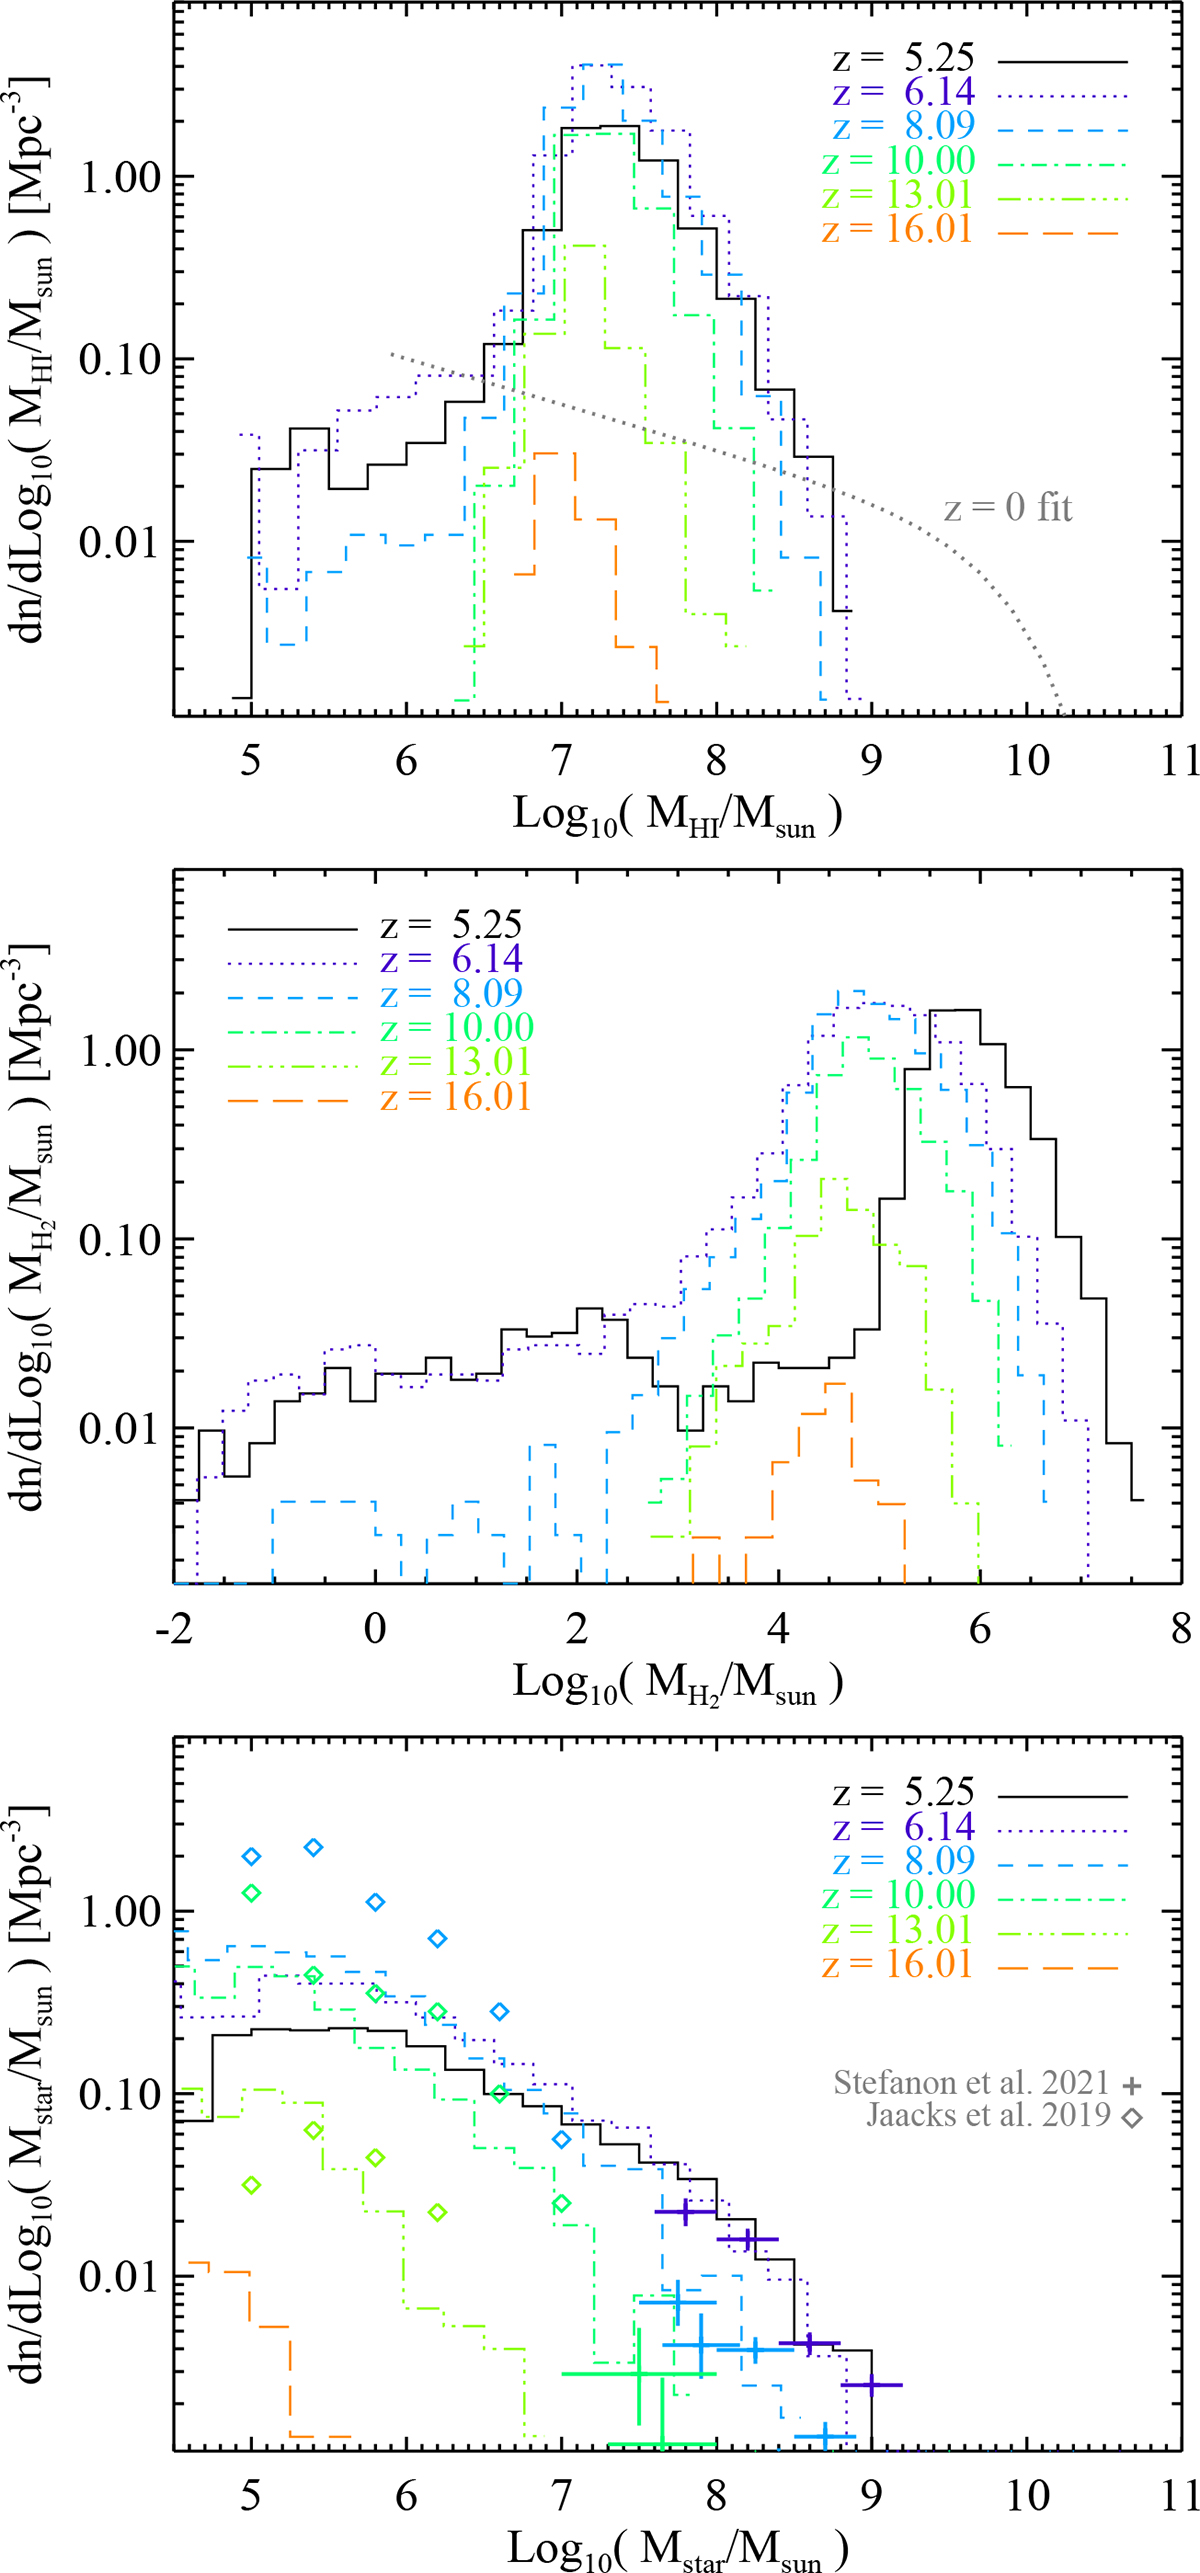
Download original image
HI (top), H2 (centre), and stellar (bottom) mass functions at different z with a fit to z = 0 ALFALFA HI data by Jones et al. (2018) (top panel, dotted grey line), z = 6–10 HST/Spitzer masses by Stefanon et al. (2021) (bottom panel, coloured crosses) and expectations by Jaacks et al. (2019) (bottom panel, coloured diamonds).
Current usage metrics show cumulative count of Article Views (full-text article views including HTML views, PDF and ePub downloads, according to the available data) and Abstracts Views on Vision4Press platform.
Data correspond to usage on the plateform after 2015. The current usage metrics is available 48-96 hours after online publication and is updated daily on week days.
Initial download of the metrics may take a while.