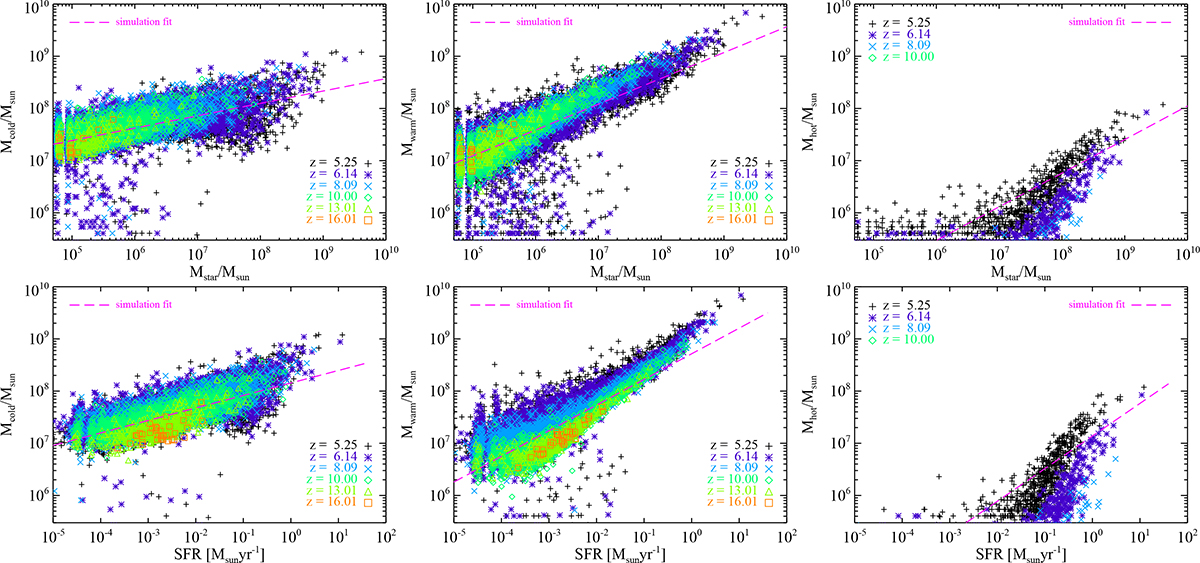
Fig. 6.
Download original image
Cold (left column), warm (central column), and hot (right column) gas mass versus Mstar (top row) and SFR (bottom row) for galaxies at redshift z = 5.25, 6.14, 8.09, 10.00, 13.01, and 16.01, with simulation fits (dashed magenta lines) reported in Appendix F (Table F.1). Different gas phases probe different Mstar and SFR regimes with little redshift evolution, but a large environment and feedback-driven scatter.
Current usage metrics show cumulative count of Article Views (full-text article views including HTML views, PDF and ePub downloads, according to the available data) and Abstracts Views on Vision4Press platform.
Data correspond to usage on the plateform after 2015. The current usage metrics is available 48-96 hours after online publication and is updated daily on week days.
Initial download of the metrics may take a while.