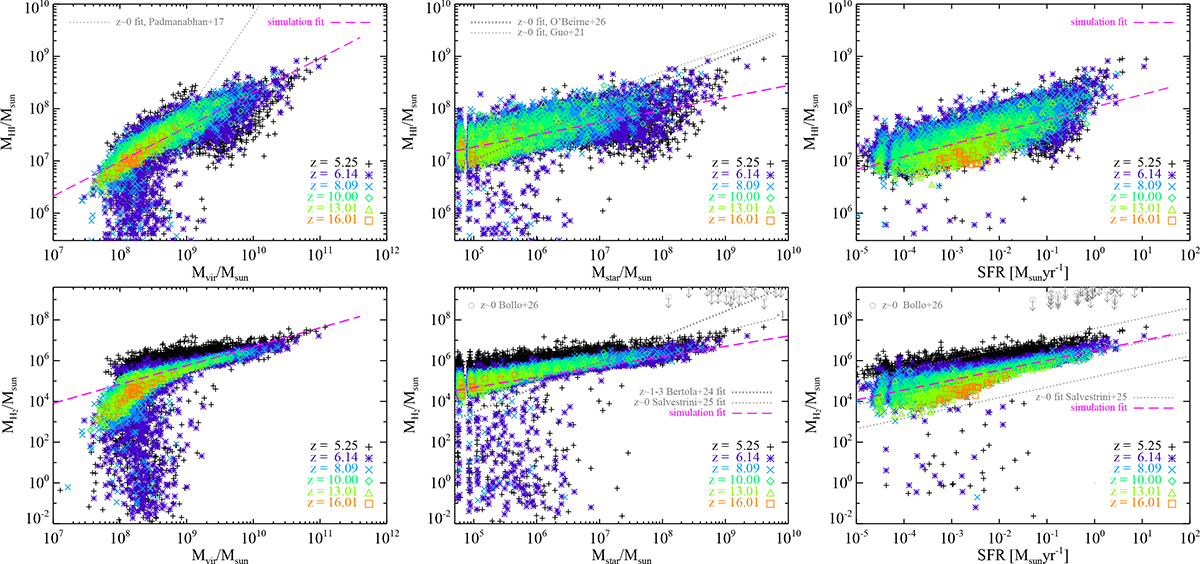
Fig. 7.
Download original image
HI (top) and H2 (bottom) masses versus Mvir (left), Mstar (centre), and SFR (right). Observational fits for HI and H2 data are shown by grey dotted lines and MUSE-ALMA Haloes H2 upper limits (Bollo et al. 2026) by grey circles and arrows. The fit to the MUSE-ALMA Haloes MHI vs. Mstar is Log(MHI/M⊙) = 0.50 Log(Mstar/M⊙)+4.52 (O’Beirne et al. 2026, priv. comm.) and is extrapolated from galaxy data at Mstar ∼ 108–1012 M⊙. Multi-parametric fits by Salvestrini et al. (2025) are shown for SFR = 10−1 M⊙ yr−1 (lower central panel) and Mstar = 108.5, 107, and 105.5 M⊙ (dotted lines from top to bottom in the lower right panel). Simulation fits (dashed magenta lines) are in Appendix F (Table F.2). Results are little dependent on redshift and feature a large environment-driven scatter.
Current usage metrics show cumulative count of Article Views (full-text article views including HTML views, PDF and ePub downloads, according to the available data) and Abstracts Views on Vision4Press platform.
Data correspond to usage on the plateform after 2015. The current usage metrics is available 48-96 hours after online publication and is updated daily on week days.
Initial download of the metrics may take a while.